Question 6
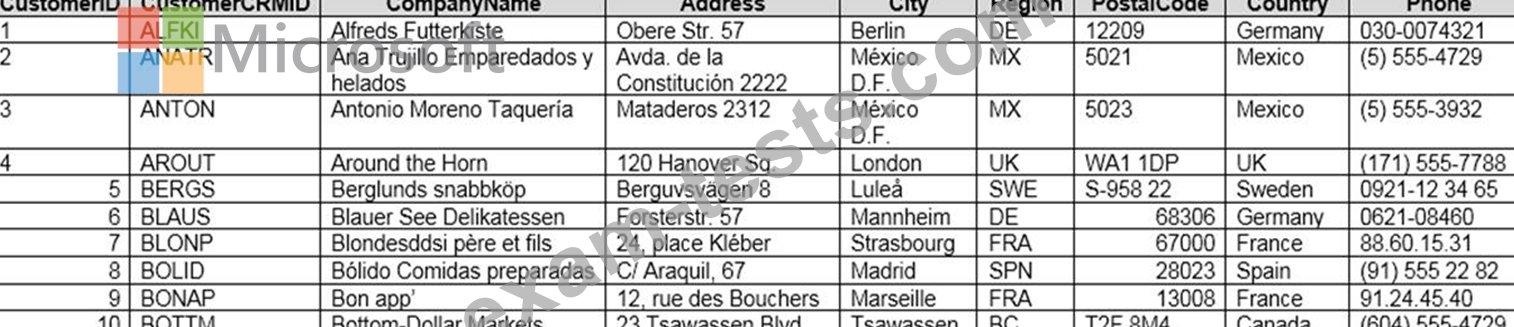
You use an R visual to produce a map of 500,000 customers. You include the values of CustomerID, Latitude, and Longitude in the fields sent to the visual. Each customer ID is unique.
In powerbi.com, when users load the visual, they only see some of the customers.
What is the cause of the issue?
In powerbi.com, when users load the visual, they only see some of the customers.
What is the cause of the issue?
Question 7
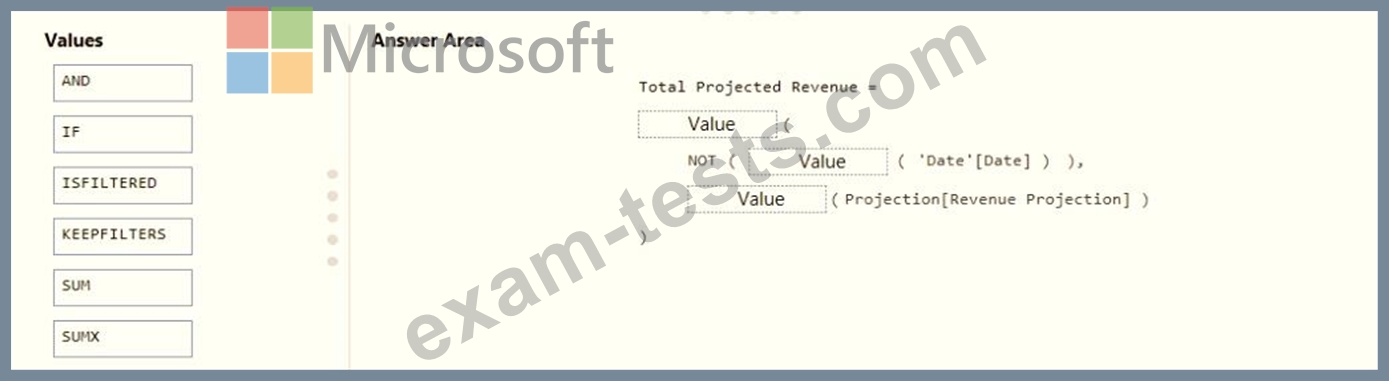
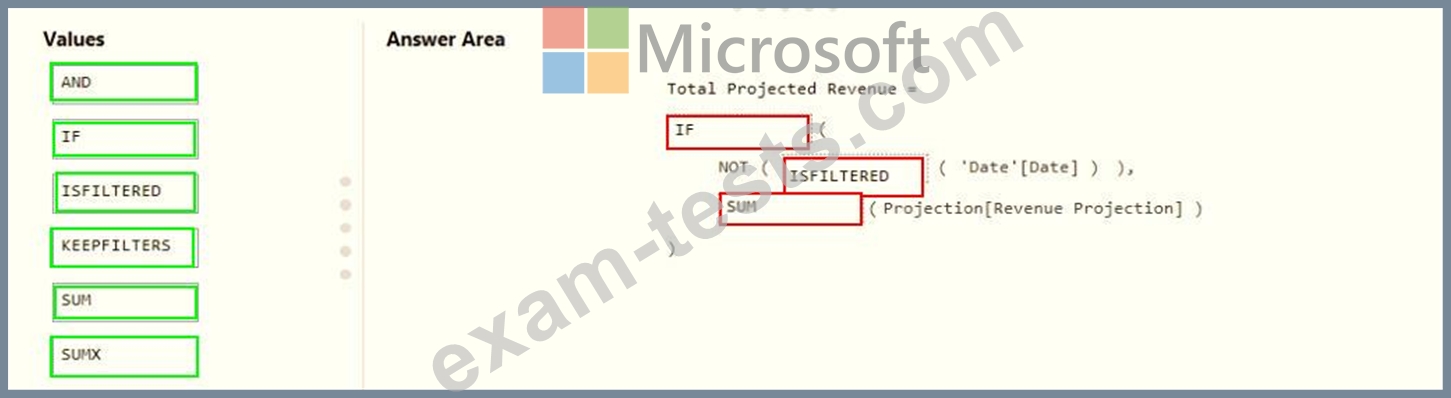
You need to create a DAX measure in the data model that only allows users to see projections at the appropriate levels of granularity.
How should you complete the measure? To answer, drag the appropriate values to the correct targets. Each value may be used once, more than once, or not at all. You may need to drag the split bar between panes or scroll to view content.
NOTE: Each correct selection is worth one point.
How should you complete the measure? To answer, drag the appropriate values to the correct targets. Each value may be used once, more than once, or not at all. You may need to drag the split bar between panes or scroll to view content.
NOTE: Each correct selection is worth one point.
Question 8
You have a Power BI report. The report contains visualizations that have interactions. You need to identify which visualizations take the longest to complete. What should you use?
Question 9
Which two types of visualizations can be used in the balance sheet reports to meet the reporting goals? Each correct answer presents part of the solution.
NOTE: Each correct selection is worth one point.
NOTE: Each correct selection is worth one point.


Question 10
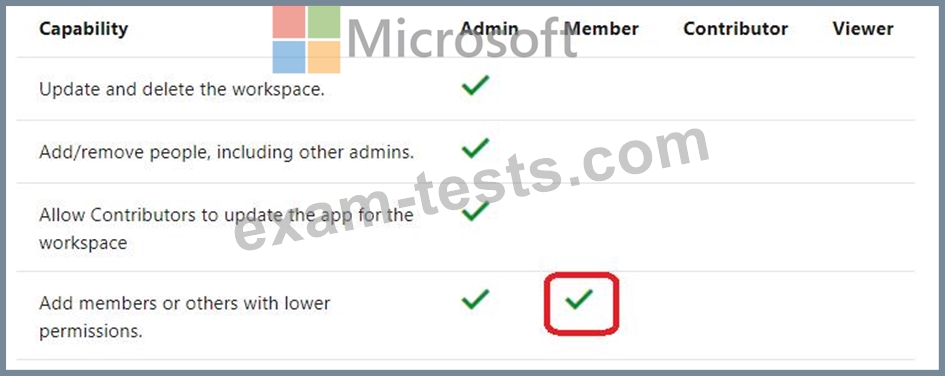
You need to provide a user with the ability to add members to a workspace. The solution must use the principle of least privilege.
Which role should you assign to the user?
Which role should you assign to the user?