Question 11
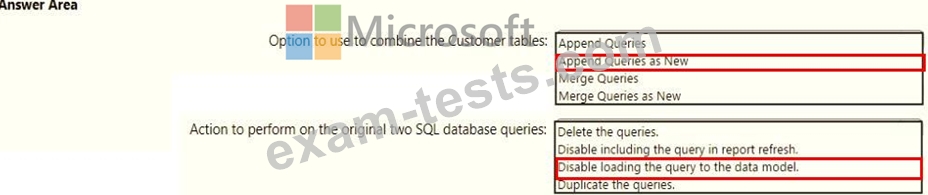
You have two Azure SQL databases that contain the same tables and columns.
For each database, you create a query that retrieves data from a table named Customers.
You need to combine the Customer tables into a single table. The solution must minimize the size of the data model and support scheduled refresh in powerbi.com.
What should you do? To answer, select the appropriate options in the answer area.
NOTE: Each correct selection is worth one point.
Question 12
You need to create the required relationship for the executive's visual. What should you do before you can create the relationship?
Question 13
In Power Bi Desktop, you are creating visualizations in a report based on an imported dataset You need to allow Power Bi users to export the summarized data used to create the visualizations but prevent the users from exporting the underlying data What should you do?
Question 14
You have a Microsoft Power BI data model that contains three tables named Orders, Date, and City. There is a one-to-many relationship between Date and Orders and between City and Orders.
The model contains two row-level security (RLS) roles named Role1 and Role2. Role1 contains the following filter.
City[State Province] = "Kentucky"
Role2 contains the following filter.
Date[Calendar Year] = 2020
If a user is a member of both Role1 and Role2, what data will they see in a report that uses the model?
Question 15
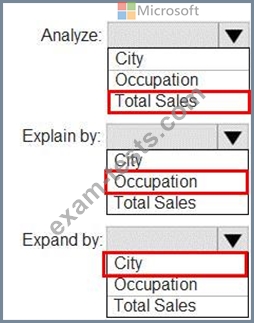
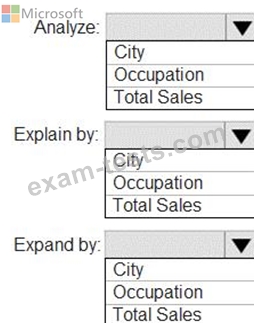
You have a table that contains the following three columns:
City
Total Sales
Occupation
You need to create a key influencers visualization as shown in the exhibit. (Click the Exhibit tab.)
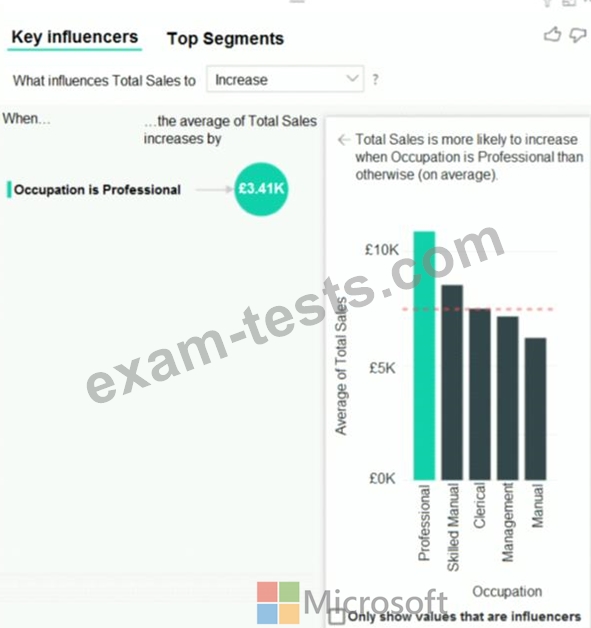
How should you configure the visualization? To answer, select the appropriate options in the answer area.
NOTE: Each correct selection is worth one point.
City
Total Sales
Occupation
You need to create a key influencers visualization as shown in the exhibit. (Click the Exhibit tab.)
How should you configure the visualization? To answer, select the appropriate options in the answer area.
NOTE: Each correct selection is worth one point.