Question 16
You build a report to help the sales team understand its performance and the drivers of sales. The team needs to have a single visualization to identify which factors affect success. Which type of visualization should you use?
Question 17
You need to create a calculated column to display the month based on the reporting requirements. Which DAX expression should you use?
Question 18
What should you create to meet the reporting requirements of the sales department?
Question 19
You need to provide a solution to provide the sales managers with the required access.
What should you include in the solution?
What should you include in the solution?
Question 20
You are preparing a financial report in Power BI.
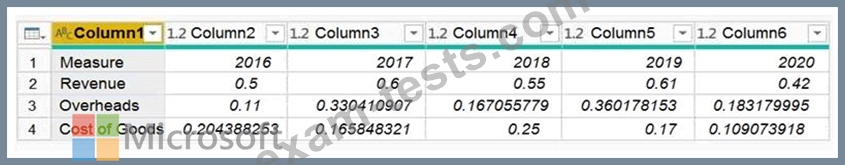
You connect to the data stored in a Microsoft Excel spreadsheet by using Power Query Editor as shown in the following exhibit.
You need to prepare the data to support the following:
Visualizations that include all measures in the data over time
Year-over-year calculations for all the measures
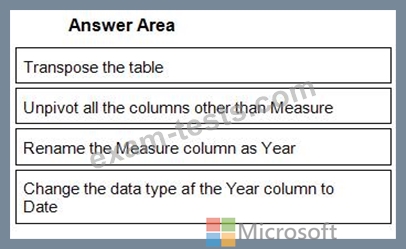
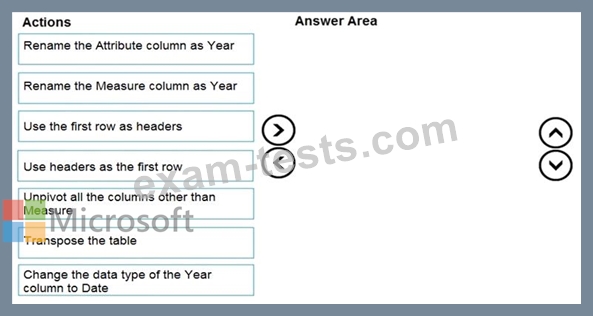
Which four actions should you perform in sequence? To answer, move the appropriate actions from the list of actions to the answer area and arrange them in the correct order.
You connect to the data stored in a Microsoft Excel spreadsheet by using Power Query Editor as shown in the following exhibit.
You need to prepare the data to support the following:
Visualizations that include all measures in the data over time
Year-over-year calculations for all the measures
Which four actions should you perform in sequence? To answer, move the appropriate actions from the list of actions to the answer area and arrange them in the correct order.