Question 76
You are developing a report page. Some users will navigate the report by using a keyboard, and some users will consume the report by using a screen reader. You need to ensure that the users can consume the content on a report page in a logical order. What should you configure in Microsoft Power Bl Desktop?
Question 77
You need to create a visual as shown in the following exhibit.
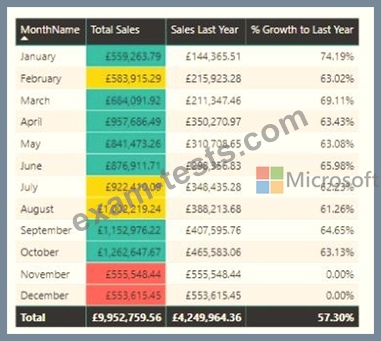
The indicator color for Total Sales will be based on % Growth to Last Year.
The solution must use the existing calculations only.
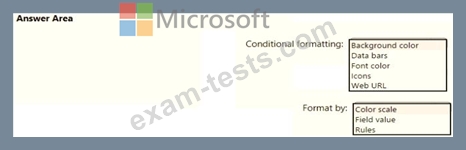
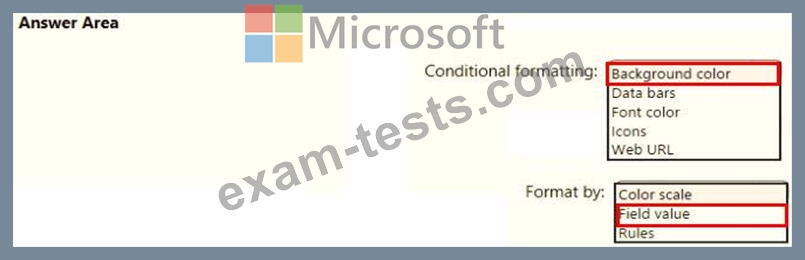
How should you configure the visual? To answer, select the appropriate options in the answer area.
NOTE: Each correct selection is worth one point.
The indicator color for Total Sales will be based on % Growth to Last Year.
The solution must use the existing calculations only.
How should you configure the visual? To answer, select the appropriate options in the answer area.
NOTE: Each correct selection is worth one point.
Question 78
You have a query named Customer that imports CSV files from a data lake. The query contains 500 rows as shown in the exhibit. (Click the Exhibit tab.)
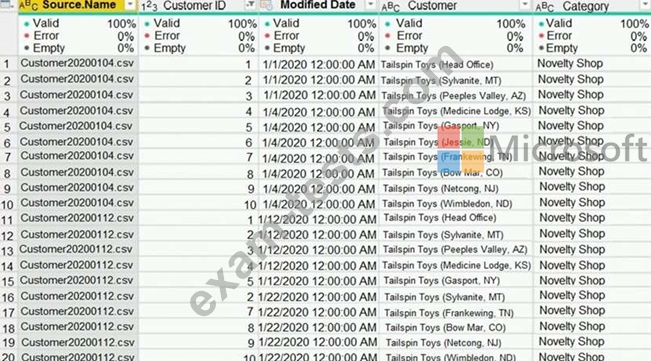
Each file contains deltas of any new or modified rows from each load to the data lake. Multiple files can have the same customer ID.
You need to keep only the last modified row for each customer ID.
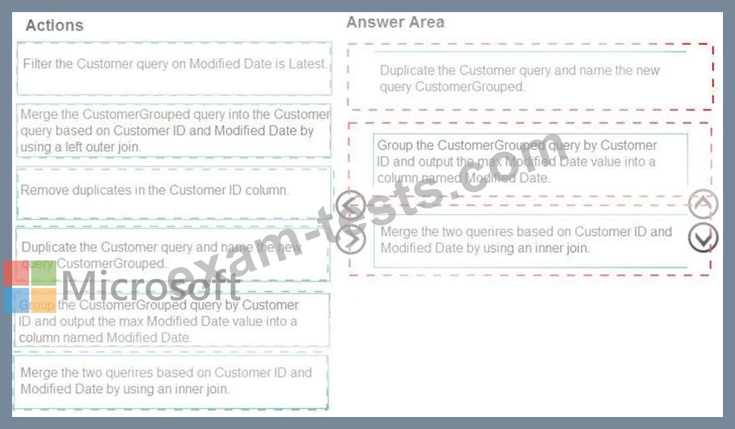
Which three actions should you perform in sequence? To answer, move the appropriate actions from the list of actions to the answer area and arrange them in the correct order.
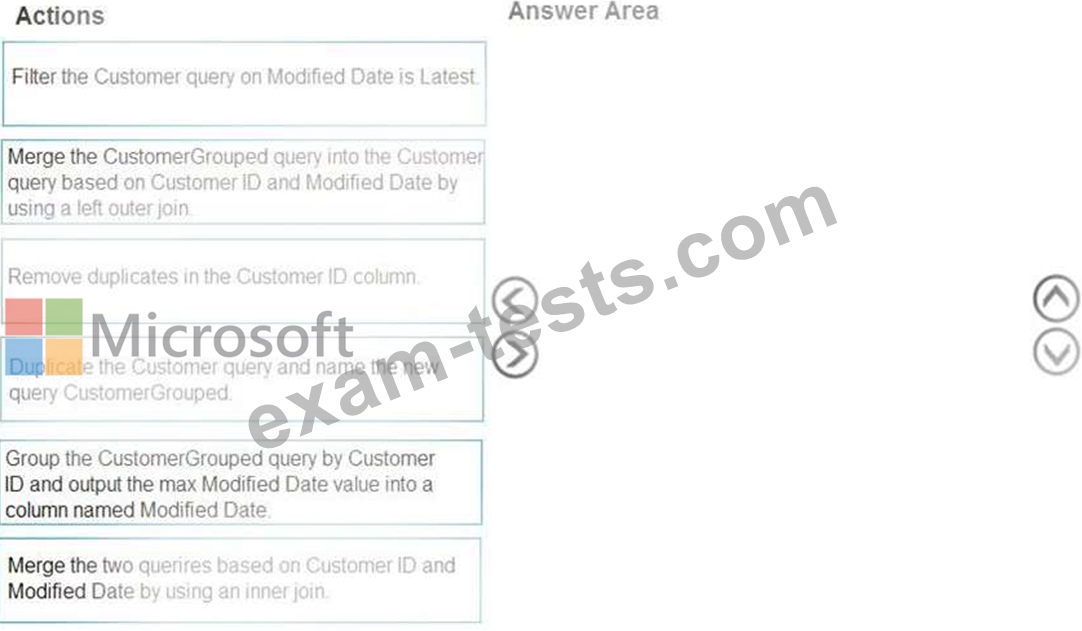
Each file contains deltas of any new or modified rows from each load to the data lake. Multiple files can have the same customer ID.
You need to keep only the last modified row for each customer ID.
Which three actions should you perform in sequence? To answer, move the appropriate actions from the list of actions to the answer area and arrange them in the correct order.
Question 79
You have an API that returns more than 100 columns. The following is a sample of column names.
* client_notified_timestamp
* client_notified_source
* client_notified_sourceid
* client_notified_value
* client_responded_timestamp
* client_responded_source
* client_responded_sourceid
* client_responded_value
You plan to include only a subset of the returned columns.
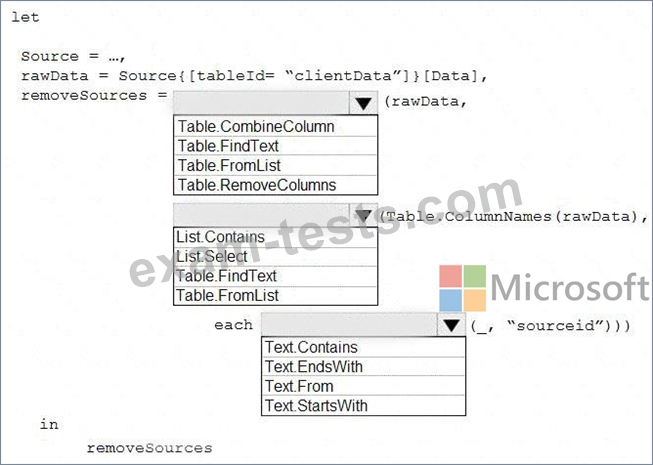
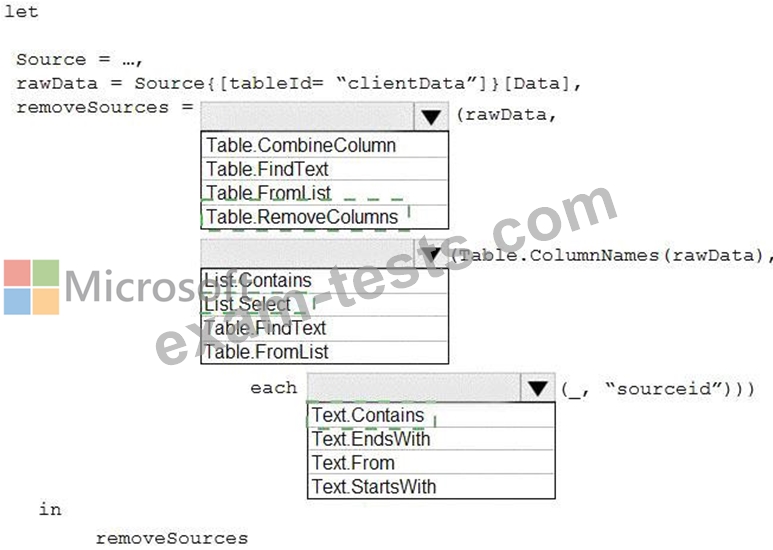
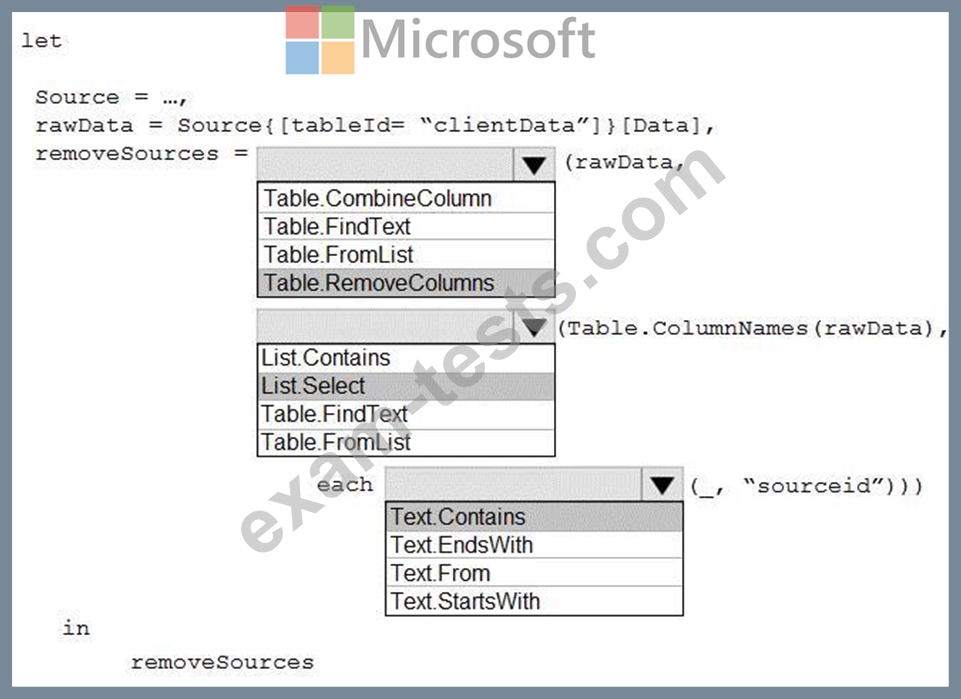
You need to remove any columns that have a suffix of sourceid.
How should you complete the Power Query M code? To answer, select the appropriate options in the answer area.
NOTE: Each correct selection is worth one point.
* client_notified_timestamp
* client_notified_source
* client_notified_sourceid
* client_notified_value
* client_responded_timestamp
* client_responded_source
* client_responded_sourceid
* client_responded_value
You plan to include only a subset of the returned columns.
You need to remove any columns that have a suffix of sourceid.
How should you complete the Power Query M code? To answer, select the appropriate options in the answer area.
NOTE: Each correct selection is worth one point.
Question 80
You have a report page that contains the visuals shown in the following exhibit.
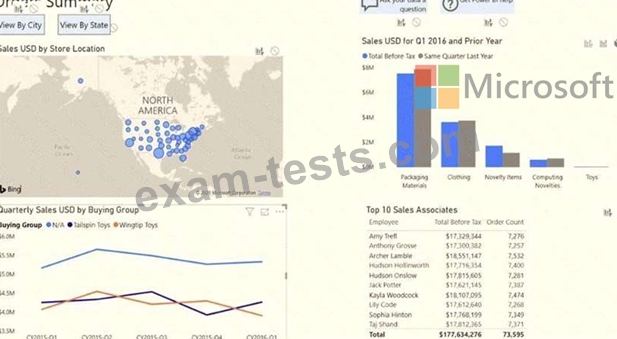
Use the drop-down menus to select the answer choice that completes each statement based on the information presented in the graphic. NOTE: Each correct selection is worth one point.

Use the drop-down menus to select the answer choice that completes each statement based on the information presented in the graphic. NOTE: Each correct selection is worth one point.