
Question 91
You create a dataset sourced from dozens of flat files in Azure Blob storage. The dataset uses incremental refresh.
From powerbi.com, you deploy the dataset and several related reports to Microsoft Power BI Premium capacity.
You discover that the dataset refresh fails after the refresh runs out of resources.
What is a possible cause of the issue?
From powerbi.com, you deploy the dataset and several related reports to Microsoft Power BI Premium capacity.
You discover that the dataset refresh fails after the refresh runs out of resources.
What is a possible cause of the issue?
Question 92
You have a dashboard that contains tiles pinned from a single report as shown in the Original Dashboard exhibit. (Click the Original Dashboard tab.)

You need to modify the dashboard to appear as shown in the Modified Dashboard exhibit. (Click the Modified Dashboard tab.)

What should you do?
You need to modify the dashboard to appear as shown in the Modified Dashboard exhibit. (Click the Modified Dashboard tab.)
What should you do?
Question 93
You build a report to help the sales team understand its performance and the drivers of sales. The team needs to have a single visualization to identify which factors affect success. Which type of visualization should you use?
Question 94
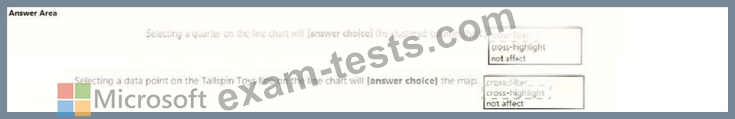
You have a report page that contains the visuals shown in the following exhibit.

Use the drop-down menus to select the answer choice that completes each statement based on the information presented in the graphic. NOTE: Each correct selection is worth one point.
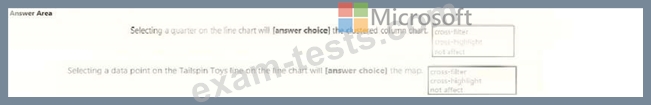
Use the drop-down menus to select the answer choice that completes each statement based on the information presented in the graphic. NOTE: Each correct selection is worth one point.


Question 95
You have a report that contains a bar chart and a column chart. The bar chart shows customer count by customer segment. The column chart shows sales by month.
You need to ensure that when a segment is selected in the bar chart, you see which portion of the total sales for the month belongs to the customer segment.
How should the visual interactions be set on the column chart when the bar chart is selected?
You need to ensure that when a segment is selected in the bar chart, you see which portion of the total sales for the month belongs to the customer segment.
How should the visual interactions be set on the column chart when the bar chart is selected?