
Question 81
Hotspot Question
You have a dataset named Pens that contains the following columns:
- Unit Price
- Quantity Ordered
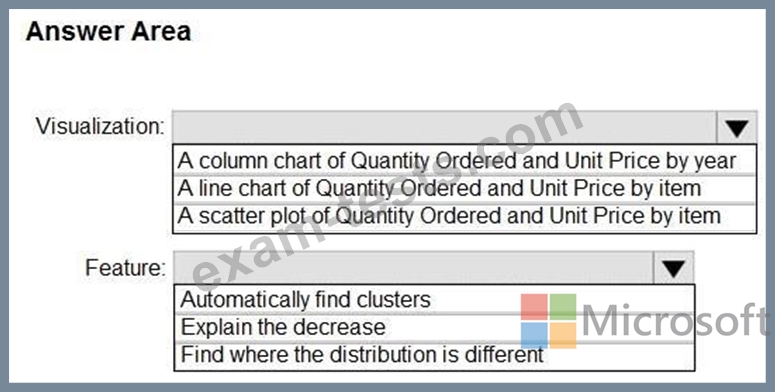
You need to create a visualization that shows the relationship between Unit Price and Quantity Ordered. The solution must highlight orders that have a similar unit price and ordered quantity.
Which type of visualization and which feature should you use? To answer, select the appropriate options in the answer area.
NOTE: Each correct selection is worth one point.
You have a dataset named Pens that contains the following columns:
- Unit Price
- Quantity Ordered
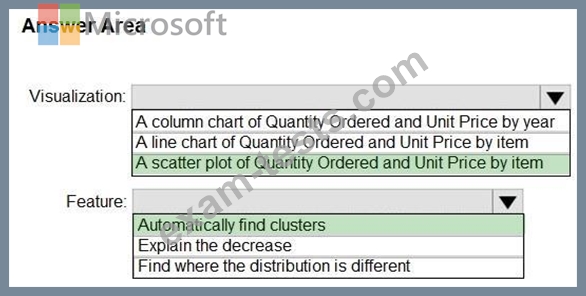
You need to create a visualization that shows the relationship between Unit Price and Quantity Ordered. The solution must highlight orders that have a similar unit price and ordered quantity.
Which type of visualization and which feature should you use? To answer, select the appropriate options in the answer area.
NOTE: Each correct selection is worth one point.
Question 82
You have two Azure SQL databases that contain the same tables and columns.
For each database, you create a query that retrieves data from a table named Customers.
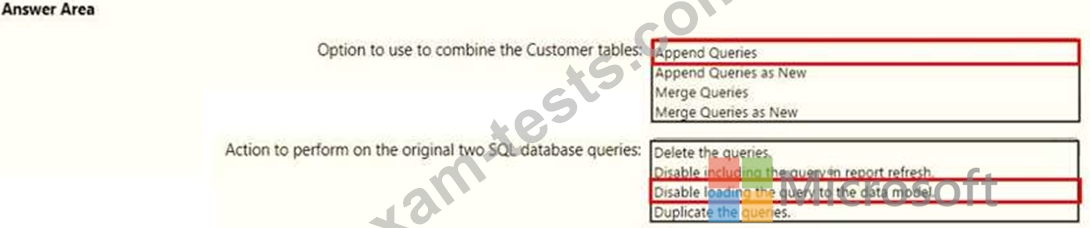
You need to combine the Customer tables into a single table. The solution must minimize the size of the data model and support scheduled refresh in powerbi.com.
What should you do? To answer, select the appropriate options in the answer area.
NOTE: Each correct selection is worth one point.

For each database, you create a query that retrieves data from a table named Customers.
You need to combine the Customer tables into a single table. The solution must minimize the size of the data model and support scheduled refresh in powerbi.com.
What should you do? To answer, select the appropriate options in the answer area.
NOTE: Each correct selection is worth one point.
Question 83
You have a folder of monthly transaction extracts.
You plan to create a report to analyze the transaction data.
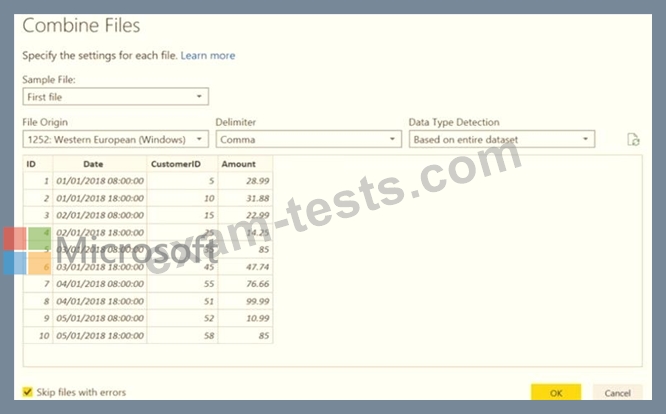
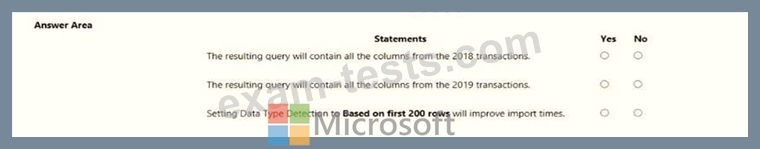
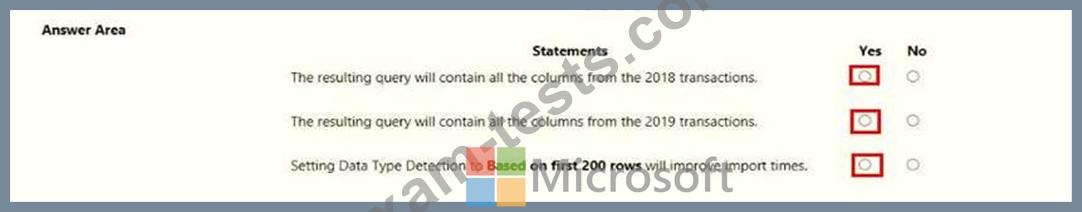
You receive the following email message: "Hi. I've put 24 files of monthly transaction data onto the shared drive. File Transactions201901.csv through Transactions201912.csv have the latest set of columns, but files Transactions201801.csv to Transactions201812.csv have an older layout without the extra fields needed for analysis. Each file contains 10 to 50 transactions." You get data from the folder and select Combine & Load. The Combine Files dialog box is shown in the exhibit. (Click the Exhibit tab.)
For each of the following statements, select Yes if the statement is true. Otherwise, select No.
NOTE: Each correct selection is worth one point.
You plan to create a report to analyze the transaction data.
You receive the following email message: "Hi. I've put 24 files of monthly transaction data onto the shared drive. File Transactions201901.csv through Transactions201912.csv have the latest set of columns, but files Transactions201801.csv to Transactions201812.csv have an older layout without the extra fields needed for analysis. Each file contains 10 to 50 transactions." You get data from the folder and select Combine & Load. The Combine Files dialog box is shown in the exhibit. (Click the Exhibit tab.)
For each of the following statements, select Yes if the statement is true. Otherwise, select No.
NOTE: Each correct selection is worth one point.
Question 84
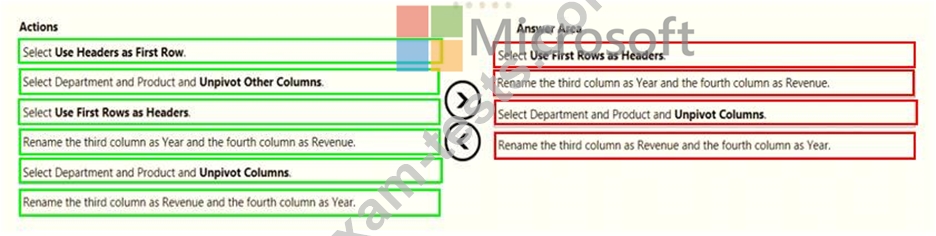
You receive revenue data that must be included in Microsoft Power Bl reports.
You perform an initial load of the data from a Microsoft Excel source as shown in the following exhibit.
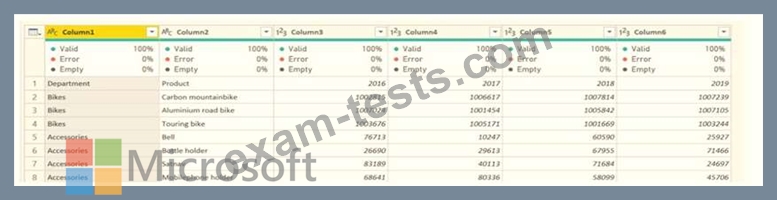
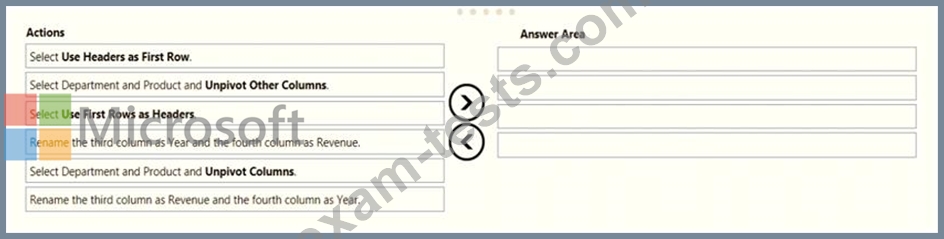
You plan to create several visuals from the data, including a visual that shows revenue split by year and product.
You need to transform the data to ensure that you can build the visuals. The solution must ensure that the columns are named appropriately for the data that they contain.
You perform an initial load of the data from a Microsoft Excel source as shown in the following exhibit.
You plan to create several visuals from the data, including a visual that shows revenue split by year and product.
You need to transform the data to ensure that you can build the visuals. The solution must ensure that the columns are named appropriately for the data that they contain.
Question 85
You have four sales regions. Each region has multiple sales managers.
You implement row-level security (RLS) in a data model. You assign the relevant distribution lists to each role.
You have sales reports that enable analysis by region. The sales managers can view the sales records of their region. The sales managers are prevented from viewing records from other regions.
A sales manager changes to a different region.
You need to ensure that the sales manager can see the correct sales data.
What should you do?