Question 1
You create a dataset sourced from dozens of flat files in Azure Blob storage. The dataset uses incremental refresh.
From powerbi.com, you deploy the dataset and several related reports to Microsoft Power BI Premium capacity.
You discover that the dataset refresh fails after the refresh runs out of resources.
What is a possible cause of the issue?
From powerbi.com, you deploy the dataset and several related reports to Microsoft Power BI Premium capacity.
You discover that the dataset refresh fails after the refresh runs out of resources.
What is a possible cause of the issue?
Question 2
You have a CSV file that contains user complaints. The file contains a column named Logged. Logged contains the date and time each compliant occurred. The data in Logged is in the following format:
2018-12-31 at 08:59.
You need to be able to analyze the complaints by the logged date and use a built-in date hierarchy.
D18912E1457D5D1DDCBD40AB3BF70D5D
What should you do?
2018-12-31 at 08:59.
You need to be able to analyze the complaints by the logged date and use a built-in date hierarchy.
D18912E1457D5D1DDCBD40AB3BF70D5D
What should you do?
Question 3
You are creating a column chart visualization.
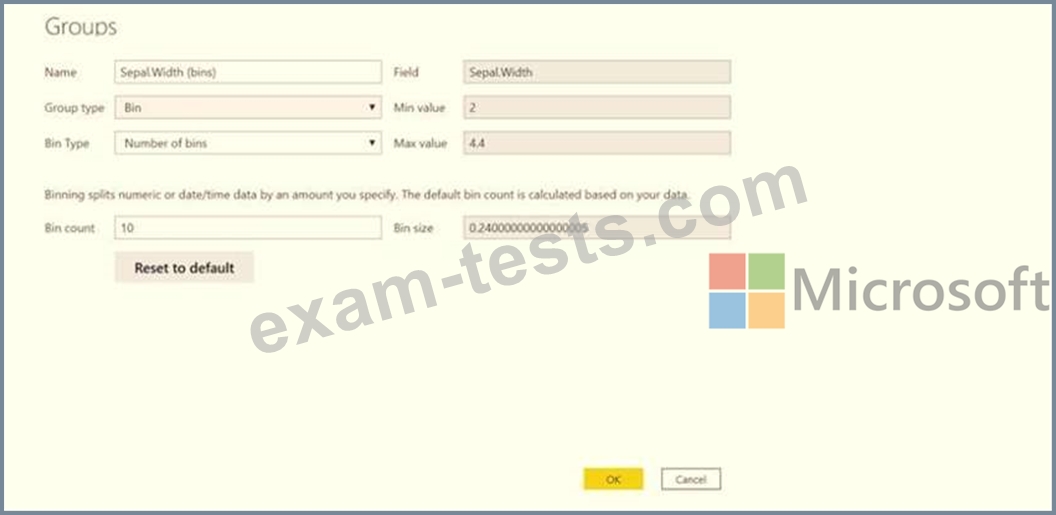
You configure groups as shown in the Groups exhibit. {Click the Groups tab.)
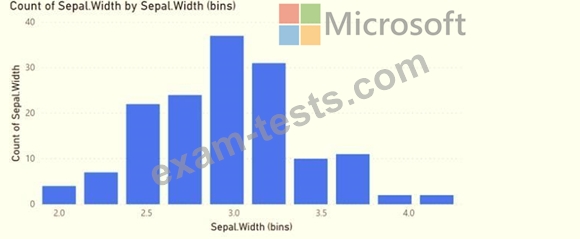
The visualization appears as shown in the Chart exhibit. (Click the Chart tab.)
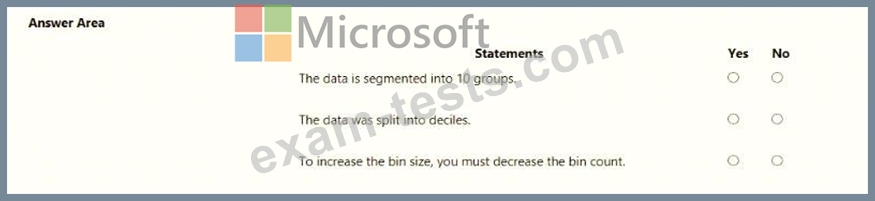
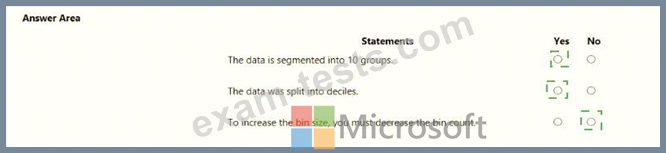
For each of the following statements, select Yes if the statement is true. Otherwise, select No.
NOTE: Each correct selection is worth one point.
You configure groups as shown in the Groups exhibit. {Click the Groups tab.)
The visualization appears as shown in the Chart exhibit. (Click the Chart tab.)
For each of the following statements, select Yes if the statement is true. Otherwise, select No.
NOTE: Each correct selection is worth one point.
Question 4
You have a Power BI Desktop project that has the model shown in the exhibit. (Click the Exhibit tab.)
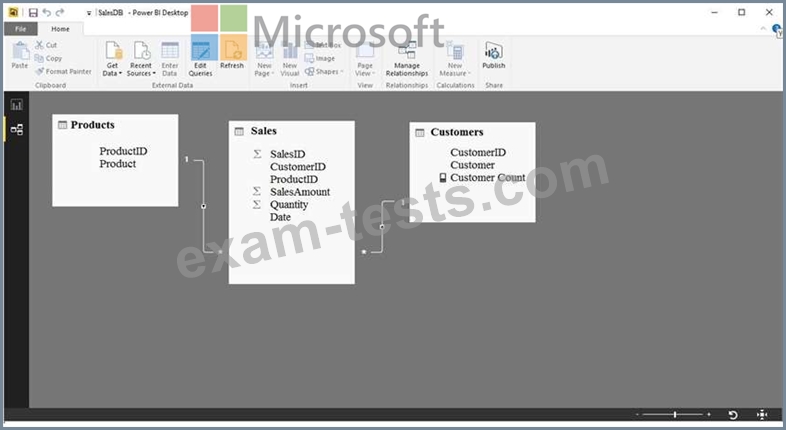
Customer Count is a measure that uses the CountRows function to calculate the number of customers.
You create a table visualization that displays ProductID, Product, and Customer Count.
When you view the table, you discover that Customer Count always displays the total number of customers instead of the number of customers who purchased the product.
You need to ensure that the table visualization displays the number of customers who purchased each product.
What should you do?
Question 5
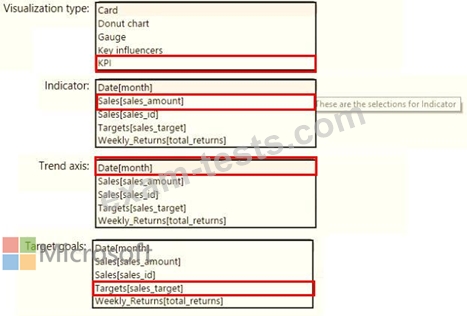
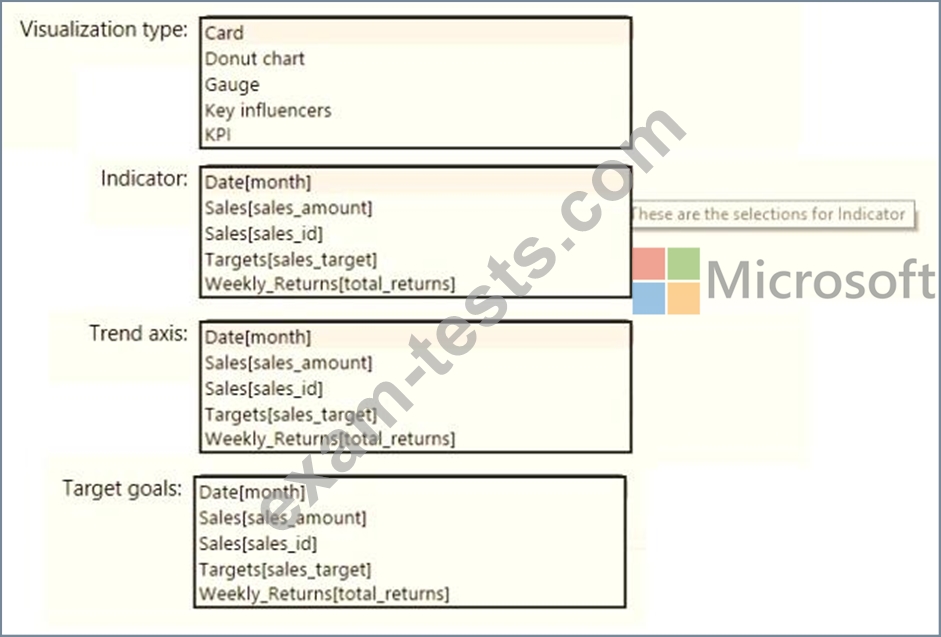
You need to create a visualization to meet the reporting requirements of the sales managers.
How should you create the visualization? To answer, select the appropriate options in the answer area.
NOTE: Each correct selection is worth one point.
How should you create the visualization? To answer, select the appropriate options in the answer area.
NOTE: Each correct selection is worth one point.