Question 1
Note: This question is part of a series of questions that present the same scenario. Each question in the series contains a unique solution that might meet the stated goals. Some question sets might have more than one correct solution, while others might not have a correct solution.
After you answer a question in this scenario, you will NOT be able to return to it. As a result, these questions will not appear in the review screen.
You have a clustered bar chart that contains a measure named Salary as the value and a field named Employee as the axis. Salary is present in the data as numerical amount representing US dollars.
You need to create a reference line to show which employees are above the median salary.
Solution: You create a percentile line by using the Salary measure and set the percentile to 50%.
Does this meet the goal?
Question 2
You have the line chart shown in the exhibit. (Click the Exhibit tab.)
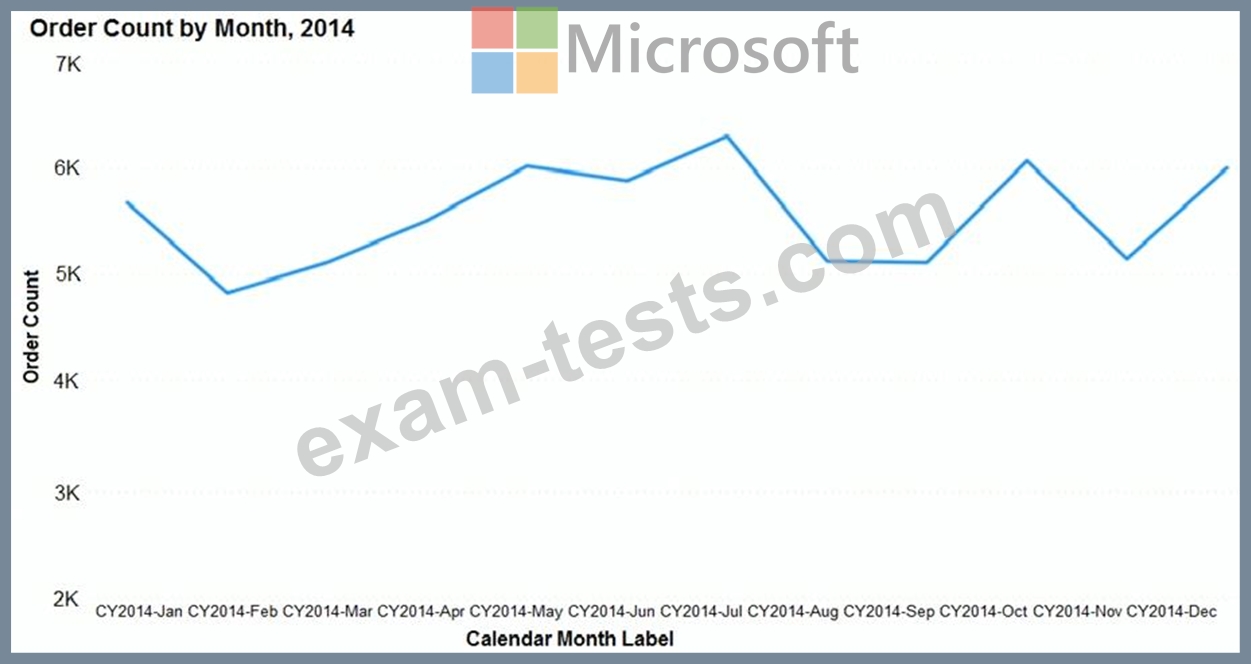
You need to modify the chart to meet the following requirements:
Identify months that have order counts above the mean.
Display the mean monthly order count.
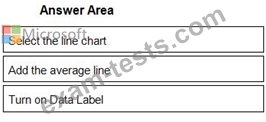
Which three actions should you perform in sequence? To answer, move the appropriate actions from the list of actions to the answer area and arrange them in the correct order.
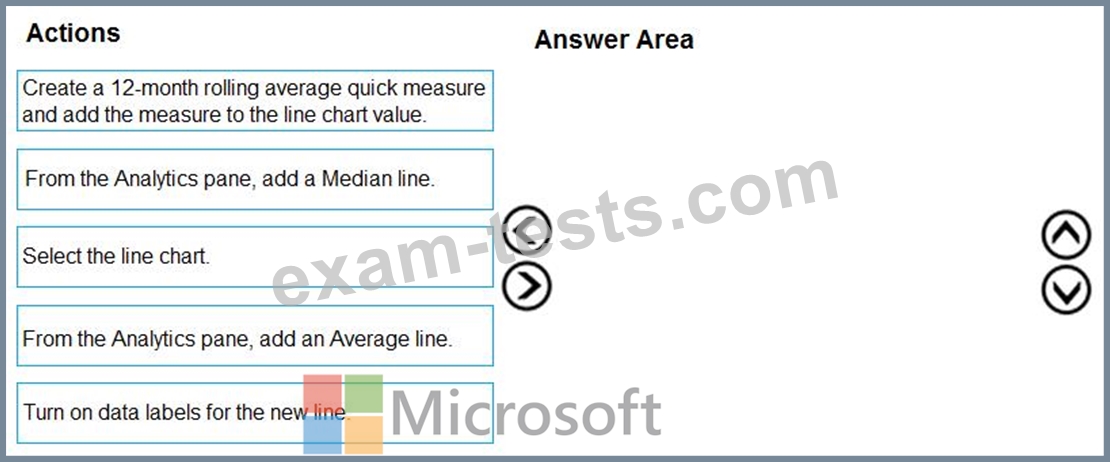
You need to modify the chart to meet the following requirements:
Identify months that have order counts above the mean.
Display the mean monthly order count.
Which three actions should you perform in sequence? To answer, move the appropriate actions from the list of actions to the answer area and arrange them in the correct order.
Question 3
You have a Power Bi report for the procurement department. The report contains data from the following tables.
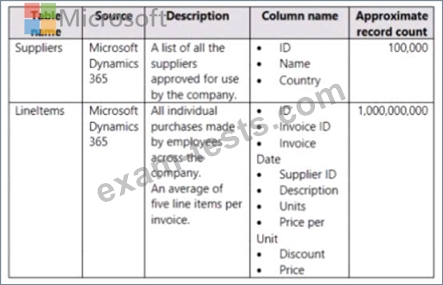
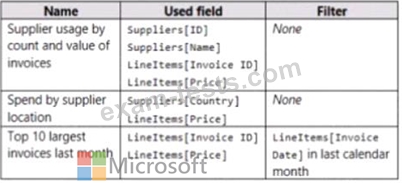
There is a one-to-many relationship from Suppliers to Lineitems that uses the ID and Supplier ID columns. The report contains the visuals shown in the following table.
You need to minimize the size of the dataset without affecting the visuals. What should you do?
There is a one-to-many relationship from Suppliers to Lineitems that uses the ID and Supplier ID columns. The report contains the visuals shown in the following table.
You need to minimize the size of the dataset without affecting the visuals. What should you do?
Question 4
You have a Power BI dashboard that monitors the quality of manufacturing processes. The dashboard contains the following elements:
A line chart that shows the number of defective products manufactured by day.
A KPI visual that shows the current daily percentage of defective products manufactured.
You need to be notified when the daily percentage of defective products manufactured exceeds 3%.
What should you create?
A line chart that shows the number of defective products manufactured by day.
A KPI visual that shows the current daily percentage of defective products manufactured.
You need to be notified when the daily percentage of defective products manufactured exceeds 3%.
What should you create?
Question 5
You have two tables named Customers and Invoice in a Power BI model. The Customers table contains the following fields:
CustomerID
Customer City
Customer State
Customer Name
Customer Address 1
Customer Address 2
Customer Postal Code
The Invoice table contains the following fields:
Order ID
Invoice ID
Invoice Date
Customer ID
Total Amount
Total Item Count
The Customers table is related to the Invoice table through the Customer ID columns. A customer can have many invoices within one month.
The Power BI model must provide the following information:
The number of customers invoiced in each state last month
The average invoice amount per customer in each postal code
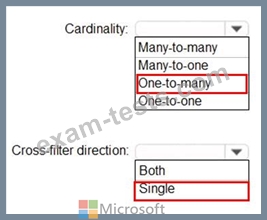
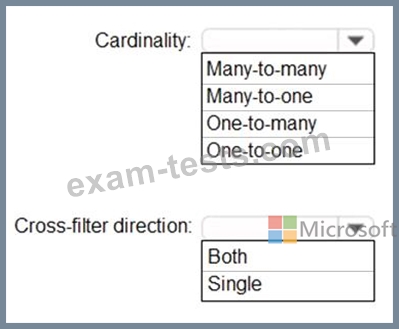
You need to define the relationship from the Customers table to the Invoice table. The solution must optimize query performance.
What should you configure? To answer, select the appropriate options in the answer area.
NOTE: Each correct selection is worth one point.
CustomerID
Customer City
Customer State
Customer Name
Customer Address 1
Customer Address 2
Customer Postal Code
The Invoice table contains the following fields:
Order ID
Invoice ID
Invoice Date
Customer ID
Total Amount
Total Item Count
The Customers table is related to the Invoice table through the Customer ID columns. A customer can have many invoices within one month.
The Power BI model must provide the following information:
The number of customers invoiced in each state last month
The average invoice amount per customer in each postal code
You need to define the relationship from the Customers table to the Invoice table. The solution must optimize query performance.
What should you configure? To answer, select the appropriate options in the answer area.
NOTE: Each correct selection is worth one point.