
Question 46
You have a Microsoft SharePoint Online site that contains several document libraries. One of the document libraries contains manufacturing reports saved as Microsoft Excel files. All the manufacturing reports have the same data structure.
You need to load only the manufacturing reports to a table for analysis.
What should you do in Microsoft Power Bl Desktop?
You need to load only the manufacturing reports to a table for analysis.
What should you do in Microsoft Power Bl Desktop?
Question 47
You plan to create a Power Bl dataset to analyze attendance at a school. Data will come from two separate views named View1 and View? in an Azure SQL database. View1 contains the columns shown in the following table.
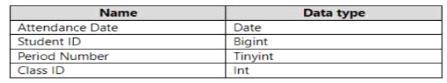
View2 contains the columns shown in the following table.
View2 contains the columns shown in the following table.
Question 48
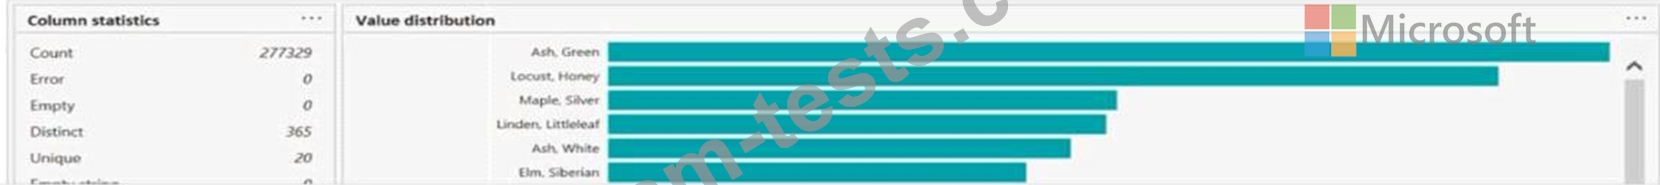
You are profiling data by using Power Query Editor.
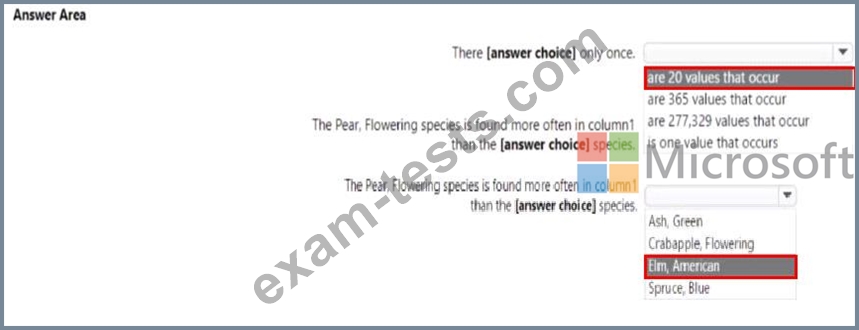
You have a table that contains a column named column1. Column statistics and Value distribution for column1 are shown in the following exhibit.
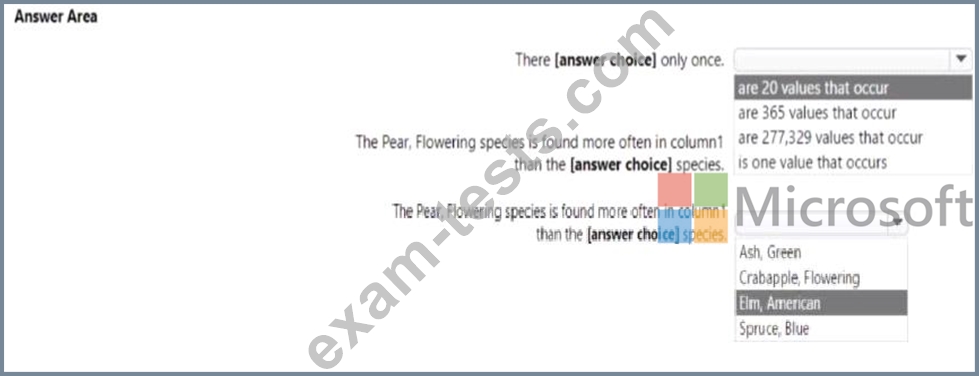
You have a table that contains a column named column1. Column statistics and Value distribution for column1 are shown in the following exhibit.
Question 49
You have a Power Bl workspace that contains several reports.
You need to provide a user with the ability to create a dashboard that will use the visuals from the reports.
What should you do?
You need to provide a user with the ability to create a dashboard that will use the visuals from the reports.
What should you do?
Question 50
Which two types of visualizations can be used in the balance sheet reports to meet the reporting goals? Each correct answer presents part of the solution.
NOTE: Each correct selection is worth one point.
NOTE: Each correct selection is worth one point.