Question 46
You have a folder of monthly transaction extracts.
You plan to create a report to analyze the transaction data.
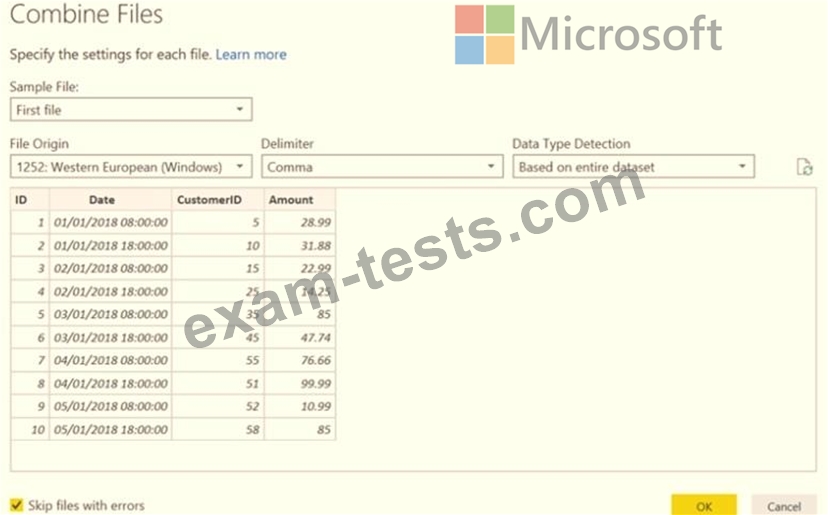
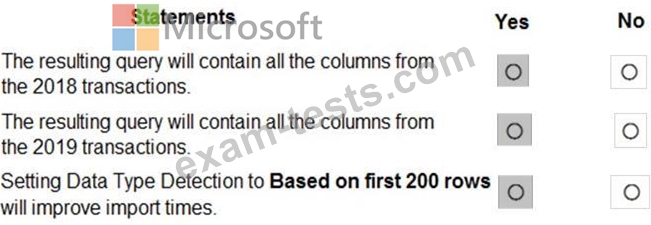
You receive the following email message: "Hi. I've put 24 files of monthly transaction data onto the shared drive. File Transactions201901.csv through Transactions201912.csv have the latest set of columns, but files Transactions201801.csv to Transactions201812.csv have an older layout without the extra fields needed for analysis. Each file contains 10 to 50 transactions." You get data from the folder and select Combine & Load. The Combine Files dialog box is shown in the exhibit. (Click the Exhibit tab.)
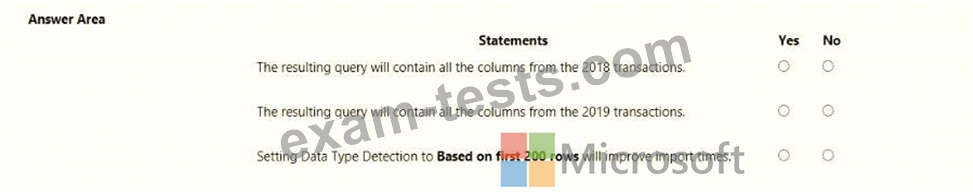
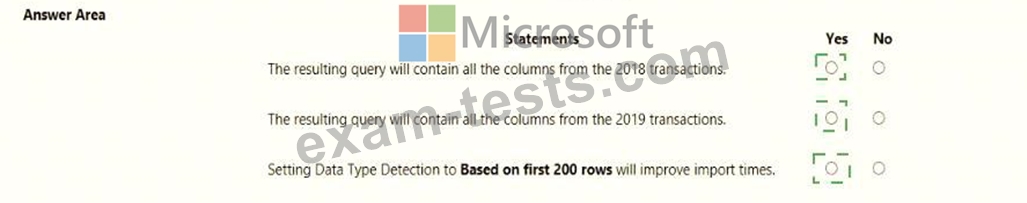
For each of the following statements, select Yes if the statement is true. Otherwise, select No.
NOTE: Each correct selection is worth one point.
You plan to create a report to analyze the transaction data.
You receive the following email message: "Hi. I've put 24 files of monthly transaction data onto the shared drive. File Transactions201901.csv through Transactions201912.csv have the latest set of columns, but files Transactions201801.csv to Transactions201812.csv have an older layout without the extra fields needed for analysis. Each file contains 10 to 50 transactions." You get data from the folder and select Combine & Load. The Combine Files dialog box is shown in the exhibit. (Click the Exhibit tab.)
For each of the following statements, select Yes if the statement is true. Otherwise, select No.
NOTE: Each correct selection is worth one point.
Question 47
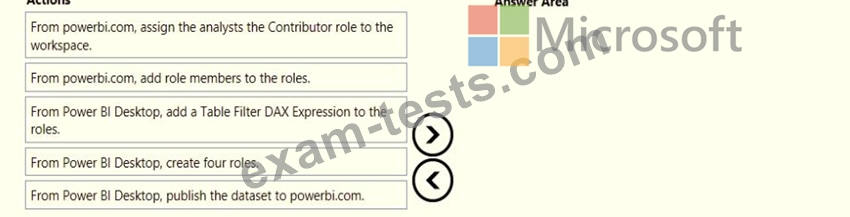
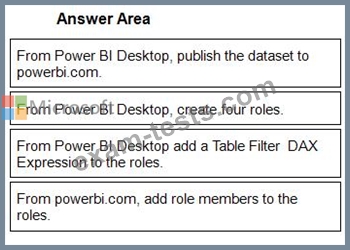
Once the profit and loss dataset is created, which four actions should you perform in sequence to ensure that the business unit analysts see the appropriate profit and loss data? To answer, move the appropriate actions from the list of actions to the answer area and arrange them in the correct order.
Question 48
Note: This question is part of a series of questions that present the same scenario. Each question in the series contains a unique solution that might meet the stated goals. Some question sets might have more than one correct solution, while others might not have a correct solution.
After you answer a question in this section, you will NOT be able to return to it. As a result, these questions will not appear in the review screen.
From Power Query Editor, you profile the data shown in the following exhibit.

The IOT ID columns are unique to each row in query.
You need to analyze 10T events by the hour and day of the year. The solution must improve dataset performance.
Solution: You change the IOT DateTime column to the Date data type.
Does this meet the goal?
After you answer a question in this section, you will NOT be able to return to it. As a result, these questions will not appear in the review screen.
From Power Query Editor, you profile the data shown in the following exhibit.
The IOT ID columns are unique to each row in query.
You need to analyze 10T events by the hour and day of the year. The solution must improve dataset performance.
Solution: You change the IOT DateTime column to the Date data type.
Does this meet the goal?
Question 49
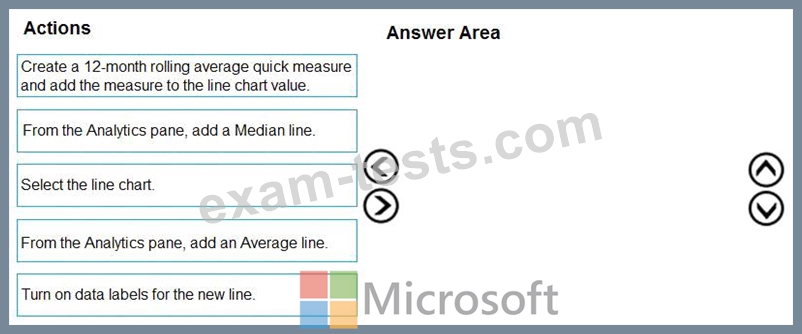
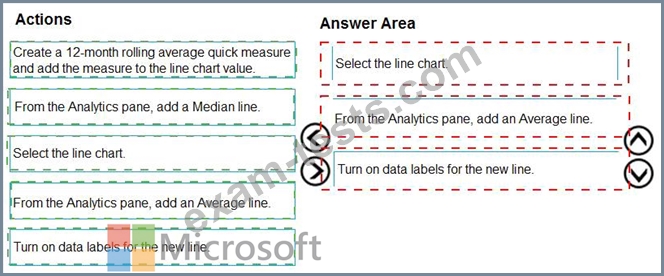
You have the line chart shown in the exhibit. (Click the Exhibit tab.)
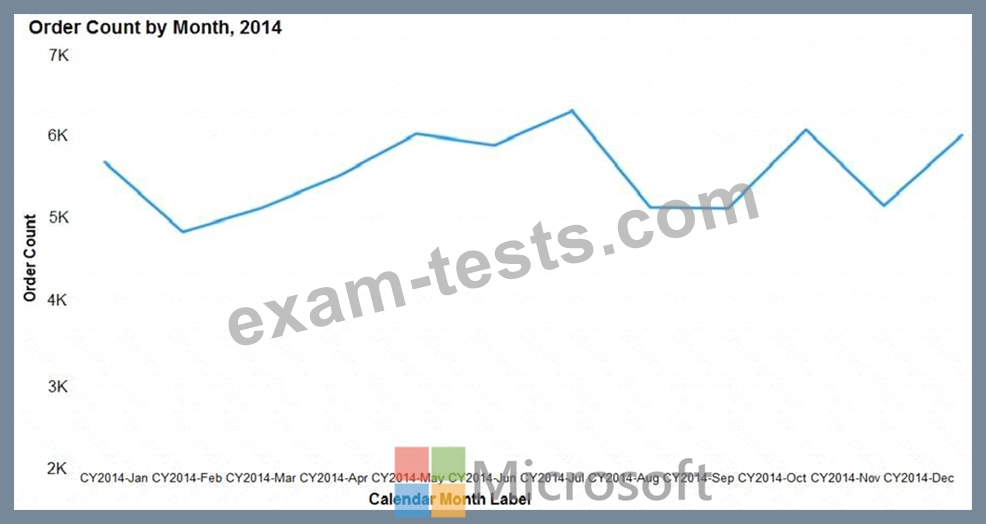
You need to modify the chart to meet the following requirements:
* Identify months that have order counts above the mean.
* Display the mean monthly order count.
Which three actions should you perform in sequence? To answer, move the appropriate actions from the list of actions to the answer area and arrange them in the correct order.
Question 50
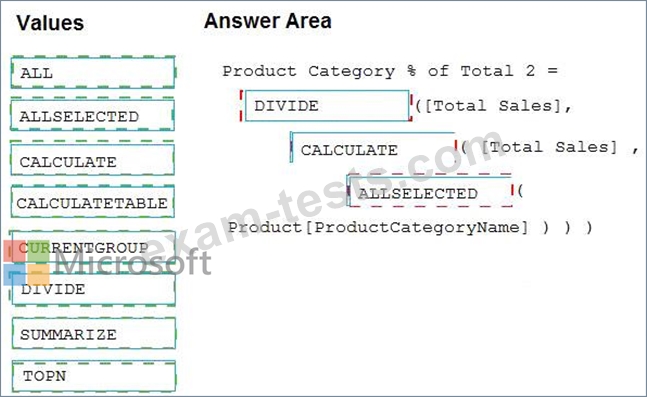
You have a Microsoft Power BI data model that contains three tables named Sales, Product, and Date.
The Sales table has an existing measure named [Total Sales] that sums the total sales from the Sales table.
You need to write a calculation that returns the percentage of total sales that a selected ProductCategoryName value represents. The calculation must respect any slicers on ProductCategoryName and must show the percentage of visible total sales. For example, if there are four ProductCategoryName values, and a user filters one out, a table showing ProductCategoryName and the calculation must sum up to 100 percent.
How should you complete the calculation? To answer, drag the appropriate values to the correct targets. Each value may be used once, more than once, or not at all. You may need to drag the split bar between panes or scroll to view content.
NOTE: Each correct selection is worth one point.