
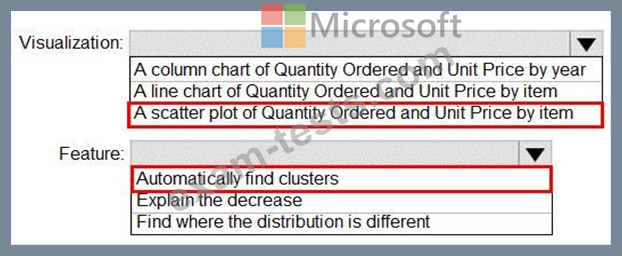
Question 51
You have a dataset named Pens that contains the following columns:
Unit Price
Quantity Ordered
You need to create a visualization that shows the relationship between Unit Price and Quantity Ordered. The solution must highlight orders that have a similar unit price and ordered quantity.
Which type of visualization and which feature should you use? To answer, select the appropriate options in the answer area.
NOTE: Each correct selection is worth one point.
Question 52
You have the Power BI data model shown in the following exhibit.

Use the drop-down menus to select the answer choice that completes each statement based on the information presented in the graphic.
NOTE: Each correct selection is worth one point.

Use the drop-down menus to select the answer choice that completes each statement based on the information presented in the graphic.
NOTE: Each correct selection is worth one point.

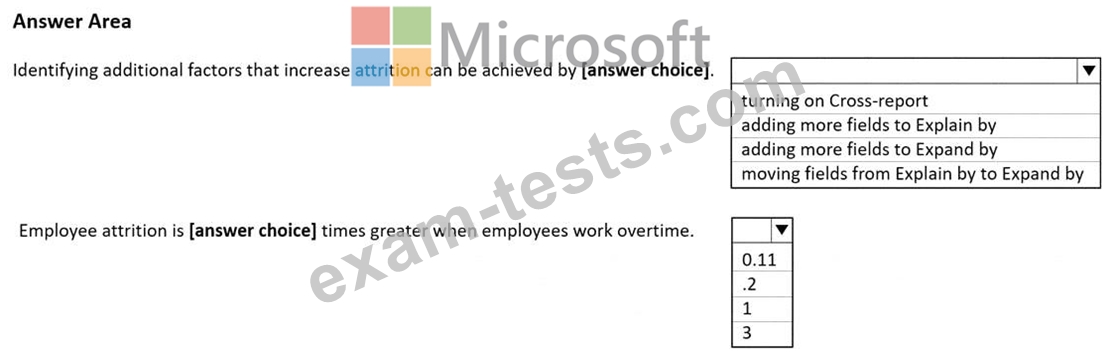
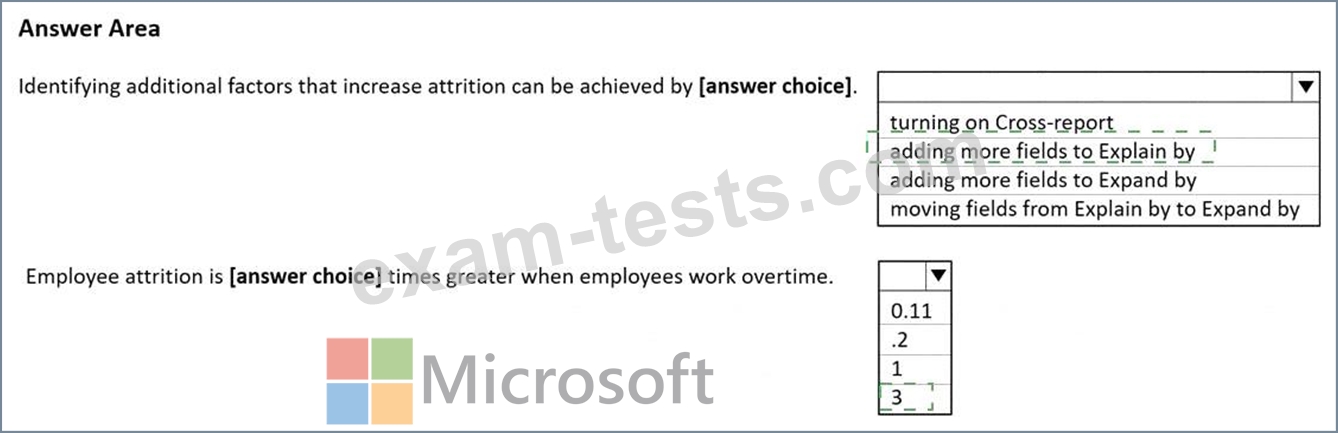
Question 53
You have a report in Power BI Desktop.
You add a key influencers visual as shown in the exhibit. (Click the Exhibit tab.)
Use the drop-down menus to select the answer choice that completes each statement based on the information presented in the graphic.
NOTE: Each correct selection is worth one point.
You add a key influencers visual as shown in the exhibit. (Click the Exhibit tab.)
Use the drop-down menus to select the answer choice that completes each statement based on the information presented in the graphic.
NOTE: Each correct selection is worth one point.
Question 54
You have two CSV files named Products and Categories.
The Products file contains the following columns:
* ProductID
* ProductName
* SupplierID
* CategoryID
The Categories file contains the following columns:
* CategoryID
* CategoryName
* CategoryDescription
From Power BI Desktop, you import the files into Power Query Editor.
You need to create a Power BI dataset that will contain a single table named Product. The Product will table includes the following columns:
* ProductID
* ProductName
* SupplierID
* CategoryID
* CategoryName
* CategoryDescription
How should you combine the queries, and what should you do on the Categories query? To answer, select the appropriate options in the answer area.
NOTE: Each correct selection is worth one point.


Question 55
What is the minimum number of datasets and storage modes required to support the reports?
Premium Bundle
Newest PL-300 Exam PDF Dumps shared by BraindumpsPass.com for Helping Passing PL-300 Exam! BraindumpsPass.com now offer the updated PL-300 exam dumps, the BraindumpsPass.com PL-300 exam questions have been updated and answers have been corrected get the latest BraindumpsPass.com PL-300 pdf dumps with Exam Engine here: