
Question 56
You need to create a DAX measure in the data model that only allows users to see projections at the appropriate levels of granularity.
How should you complete the measure? To answer, drag the appropriate values to the correct targets. Each value may be used once, more than once, or not at all. You may need to drag the split bar between panes or scroll to view content.
NOTE: Each correct selection is worth one point.

How should you complete the measure? To answer, drag the appropriate values to the correct targets. Each value may be used once, more than once, or not at all. You may need to drag the split bar between panes or scroll to view content.
NOTE: Each correct selection is worth one point.

Question 57
You are building a financial report by using Power BI.
You have a table named financials that contains a column named Date and a column named Sales.
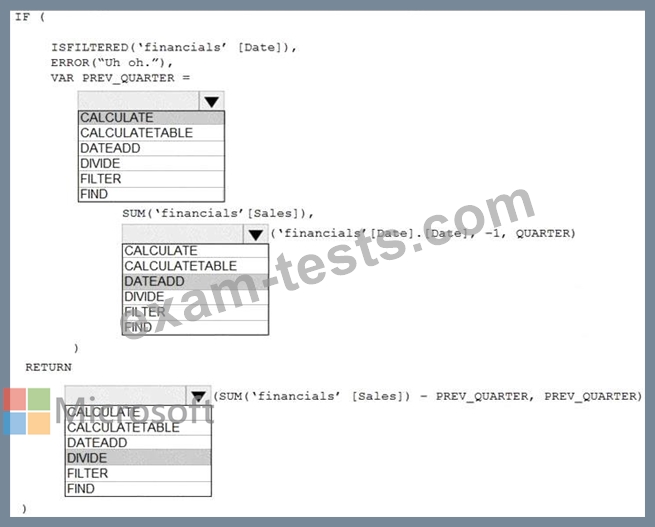
You need to create a measure that calculates the relative change in sales as compared to the previous quarter.
How should you complete the measure? To answer, select the appropriate options in the answer area.
NOTE: Each correct selection is worth one point.

You have a table named financials that contains a column named Date and a column named Sales.
You need to create a measure that calculates the relative change in sales as compared to the previous quarter.
How should you complete the measure? To answer, select the appropriate options in the answer area.
NOTE: Each correct selection is worth one point.

Question 58
You have a Microsoft SharePoint Online site that contains several document libraries. One of the document libraries contains manufacturing reports saved as Microsoft Excel files. All the manufacturing reports have the same data structure.
You need to load only the manufacturing reports to a table for analysis.
What should you do in Microsoft Power Bl Desktop?
You need to load only the manufacturing reports to a table for analysis.
What should you do in Microsoft Power Bl Desktop?
Question 59
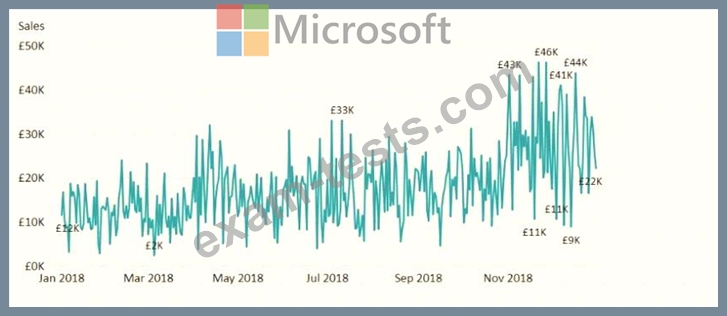
You have the visual shown in the Original exhibit. {Click the Original tab.)
You need to configure the visual as shown in the Modified exhibit. (Click the Modified tab.)
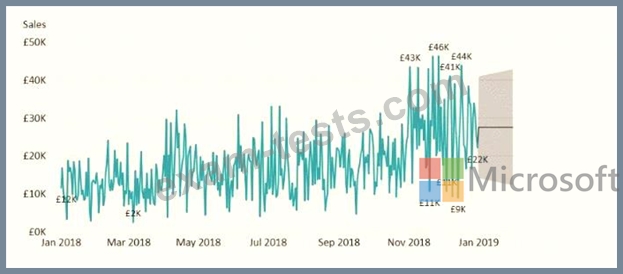
What should you add to the visual?
You need to configure the visual as shown in the Modified exhibit. (Click the Modified tab.)
What should you add to the visual?

Question 60
Note: This question is part of a series of questions that present the same scenario. Each question in the series contains a unique solution that might meet the stated goals. Some question sets might have more than one correct solution, while others might not have a correct solution.
After you answer a question in this section, you will NOT be able to return to it. As a result, these questions will not appear in the review screen.
From Power Query Editor, you profile the data shown in the following exhibit.
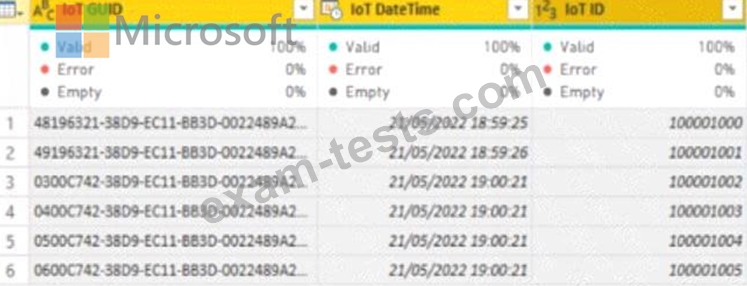
The IoT GUID and IoT ID columns are unique to each row in query.
You need to analyze IoT events by the hour and day of the year. The solution must improve dataset performance.
Solution: You remove the loT GUID column and retain the loT ID column.
Does this meet the goal?
After you answer a question in this section, you will NOT be able to return to it. As a result, these questions will not appear in the review screen.
From Power Query Editor, you profile the data shown in the following exhibit.
The IoT GUID and IoT ID columns are unique to each row in query.
You need to analyze IoT events by the hour and day of the year. The solution must improve dataset performance.
Solution: You remove the loT GUID column and retain the loT ID column.
Does this meet the goal?