
Question 286
You have a Power Bl report that contains a page. The page contains the following:
* A shape named Shape 1
* A card named Sales Summary
* A clustered bar chart named Sales by Region
You need to ensure that Sales Summary renders on top of Shape 1. What should you modify?
* A shape named Shape 1
* A card named Sales Summary
* A clustered bar chart named Sales by Region
You need to ensure that Sales Summary renders on top of Shape 1. What should you modify?

Question 287
You need to create the Top Customers report.
Which type of filter should you use, and at which level should you apply the filter? To answer, select the appropriate options in the answer area.
NOTE: Each correct selection is worth one point.

Which type of filter should you use, and at which level should you apply the filter? To answer, select the appropriate options in the answer area.
NOTE: Each correct selection is worth one point.

Question 288
You have an app workspace that contains a dashboard and four reports. All the reports are generated from a single dataset that contains sales data for your company.
The reports display the data configured as shown in the following table.

You need to ensure that the users of the reports can locate the correct report by using natural language queries.
What should you do?
The reports display the data configured as shown in the following table.
You need to ensure that the users of the reports can locate the correct report by using natural language queries.
What should you do?
Question 289
Note: This question is part of a series of questions that present the same scenario. Each question in the series contains a unique solution that might meet the stated goals. Some question sets might have more than one correct solution, while others might not have a correct solution.
After you answer a question in this section, you will NOT be able to return to it. As a result, these questions will not appear in the review screen.
From Power Query Editor, you profile the data shown in the following exhibit.

The IoT GUID and IoT ID columns are unique to each row in query.
You need to analyze IoT events by the hour and day of the year. The solution must improve dataset performance.
Solution: You remove the loT GUID column and retain the loT ID column.
Does this meet the goal?
After you answer a question in this section, you will NOT be able to return to it. As a result, these questions will not appear in the review screen.
From Power Query Editor, you profile the data shown in the following exhibit.
The IoT GUID and IoT ID columns are unique to each row in query.
You need to analyze IoT events by the hour and day of the year. The solution must improve dataset performance.
Solution: You remove the loT GUID column and retain the loT ID column.
Does this meet the goal?
Question 290
You are preparing a financial report in Power BI.
You connect to the data stored in a Microsoft Excel spreadsheet by using Power Query Editor as shown in the following exhibit.
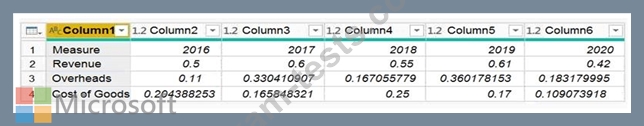
You need to prepare the data to support the following:
Visualizations that include all measures in the data over time
Year-over-year calculations for all the measures
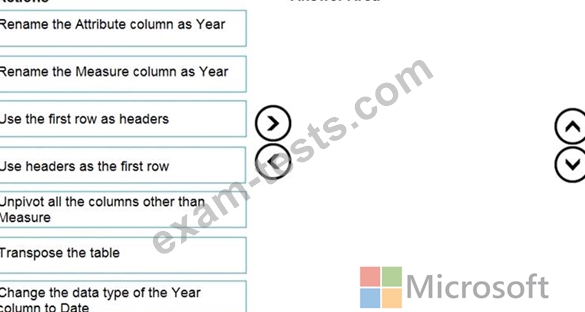
Which four actions should you perform in sequence? To answer, move the appropriate actions from the list of actions to the answer area and arrange them in the correct order.
You connect to the data stored in a Microsoft Excel spreadsheet by using Power Query Editor as shown in the following exhibit.
You need to prepare the data to support the following:
Visualizations that include all measures in the data over time
Year-over-year calculations for all the measures
Which four actions should you perform in sequence? To answer, move the appropriate actions from the list of actions to the answer area and arrange them in the correct order.
