Question 296
You are building a financial report by using Power BI.
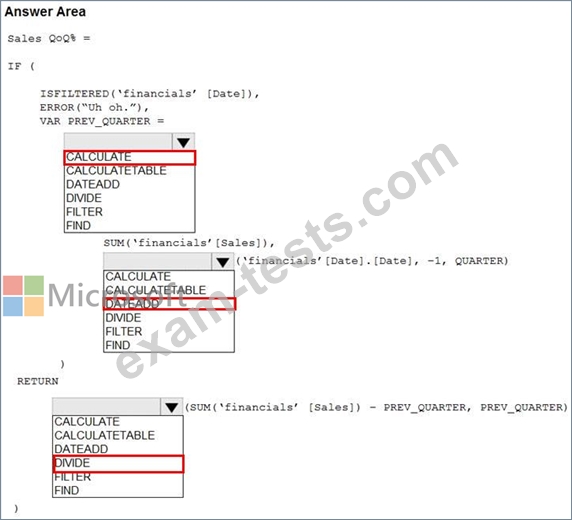
You have a table named financials that contains a column named Date and a column named Sales.
You need to create a measure that calculates the relative change in sales as compared to the previous quarter.
How should you complete the measure? To answer, select the appropriate options in the answer area.
NOTE: Each correct selection is worth one point.


Question 297
You need to create a visualization that compares revenue and cost over time.
Which type of visualization should you use?
Which type of visualization should you use?

Question 298
You are building a Power Bl report that uses data from an Azure SQL database named erp1.
You Import the following tables.
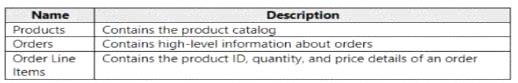
You need to perform the following analyses:
* Orders sold over time that include a measure of the total order value
* Orders by attributes of products sold
The solution must minimize update times when interacting with visuals in the report. What should you do first?
You Import the following tables.
You need to perform the following analyses:
* Orders sold over time that include a measure of the total order value
* Orders by attributes of products sold
The solution must minimize update times when interacting with visuals in the report. What should you do first?
Question 299
You plan to create a Power Bl dataset to analyze attendance at a school. Data will come from two separate views named View1 and View? in an Azure SQL database. View1 contains the columns shown in the following table.
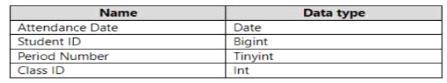
View2 contains the columns shown in the following table.

View2 contains the columns shown in the following table.

Question 300
You are building a financial report by using Power BI.
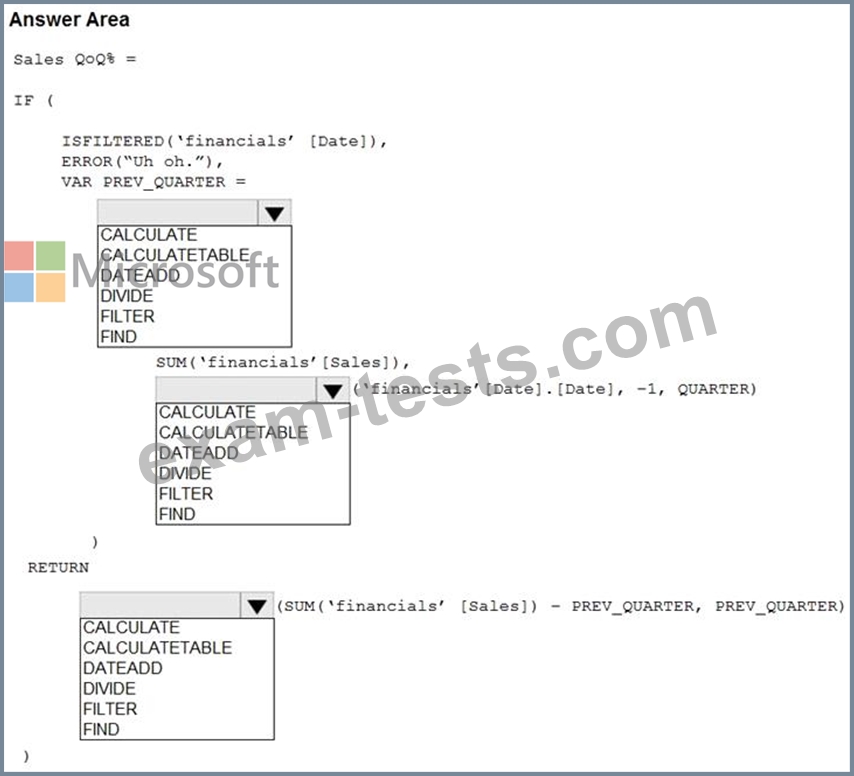
You have a table named financials that contains a column named Date and a column named Sales.
You need to create a measure that calculates the relative change in sales as compared to the previous quarter.
How should you complete the measure? To answer, select the appropriate options in the answer area.
NOTE: Each correct selection is worth one point.