
Question 301
You have the Power BI data model shown in the following exhibit.
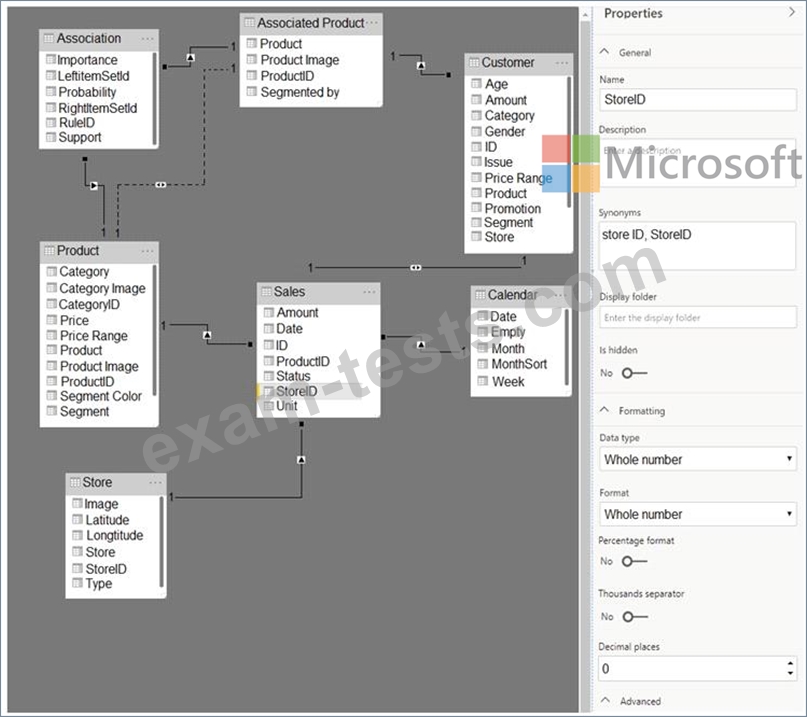
Use the drop-down menus to select the answer choice that completes each statement based on the information presented in the graphic.
NOTE: Each correct selection is worth one point.
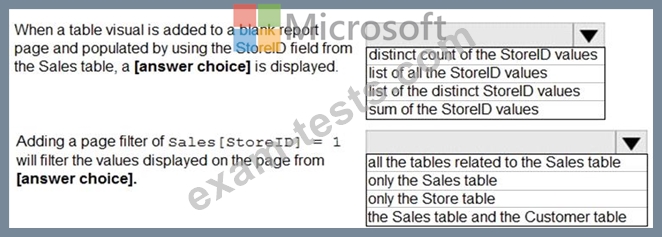
Use the drop-down menus to select the answer choice that completes each statement based on the information presented in the graphic.
NOTE: Each correct selection is worth one point.

Question 302
Note: This question is part of a series of questions that use the same scenario. For your convenience, the scenario is repeated in each question. Each question presents a different goal and answer choices, but the text of the scenario is the same in each question in this series.
You have a Microsoft SQL Server database that contains the following tables.

The following columns contain date information:
- Date[Month] in the mmyyyy format
- Date[Date_ID] in the ddmmyyyy format
- Date[Date_name] in the mm/dd/yyyy format
- Monthly_returns[Month_ID] in the mmyyyy format
The Order table contains more than one million rows.
The Store table has a relationship to the Monthly_returns table on the Store_ID column. This is the only relationship between the tables.
You plan to use Power BI Desktop to create an analytics solution for the data.
You need to create a relationship between the Order table and the Store table on the Store_ID column.
What should you do before you create the relationship?
You have a Microsoft SQL Server database that contains the following tables.
The following columns contain date information:
- Date[Month] in the mmyyyy format
- Date[Date_ID] in the ddmmyyyy format
- Date[Date_name] in the mm/dd/yyyy format
- Monthly_returns[Month_ID] in the mmyyyy format
The Order table contains more than one million rows.
The Store table has a relationship to the Monthly_returns table on the Store_ID column. This is the only relationship between the tables.
You plan to use Power BI Desktop to create an analytics solution for the data.
You need to create a relationship between the Order table and the Store table on the Store_ID column.
What should you do before you create the relationship?
Question 303
You create a dashboard by using the Microsoft Power Bl Service. The dashboard contains a card visual that shows total sales from the current year. You grant users access to the dashboard by using the viewer role on the workspace. A user wants to receive daily notifications of the number shown on the card visual. You need to automate the notifications. What should you do?
Question 304
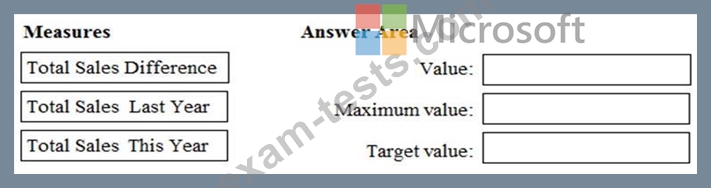
You have a Power BI model that contains a table named Sales. Sales has the following three measures:
A measure named Total Sales Last Year that displays the sales from the previous calendar year. The current value is 32.89 million.
A measure named Total Sales This Year that displays the sales from the current calendar year. The current value is 11.69 million.
A measure named Total Sales Difference that uses a DAX formula of Sales[Last Year] - Sales[This Year].
You need to create the following visualization.

How should you configure the visualization? To answer, drag the appropriate measures to the correct fields. Each value may be used once, more than once, or not at all. You may need to drag the split bar between panes or scroll to view content.
NOTE: Each correct selection is worth one point.
A measure named Total Sales Last Year that displays the sales from the previous calendar year. The current value is 32.89 million.
A measure named Total Sales This Year that displays the sales from the current calendar year. The current value is 11.69 million.
A measure named Total Sales Difference that uses a DAX formula of Sales[Last Year] - Sales[This Year].
You need to create the following visualization.
How should you configure the visualization? To answer, drag the appropriate measures to the correct fields. Each value may be used once, more than once, or not at all. You may need to drag the split bar between panes or scroll to view content.
NOTE: Each correct selection is worth one point.

Question 305
You have a Power Bl report that contains three pages. The pages are used to analyze sales across various countries.
You add a sheer named Country to each page of the report.
You need to configure the report to meet the following requirements:
* When a user selects a country on the first page, the report must filter the other pages.
* The second and third pages must display only the filtered results.
Which task should you perform for each requirement? To answer, drag the appropriate task to the correct requirement. Each task may be used once, more than once, or not at all. You may need to drag the split bar between panes or scroll to view content.Ther NOTE Each correct selection is worth one point.

