
Question 36
You want to show the cumulative total of each year for every state.
Which quick table calculation should you use?
Which quick table calculation should you use?
Question 37
A Data Analyst has a large data source that contains more than 10 million rows. Users can filter the rows by a field named Animal.
The following is a sample of the data.
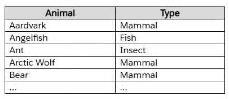
The analyst wants to ensure that every calculation is affected by including only animals of a particular type.
Which type of filter should the analyst create on the worksheet?
The following is a sample of the data.
The analyst wants to ensure that every calculation is affected by including only animals of a particular type.
Which type of filter should the analyst create on the worksheet?
Question 38
You have the following chart that sorts states by the number of products each state has purchased.
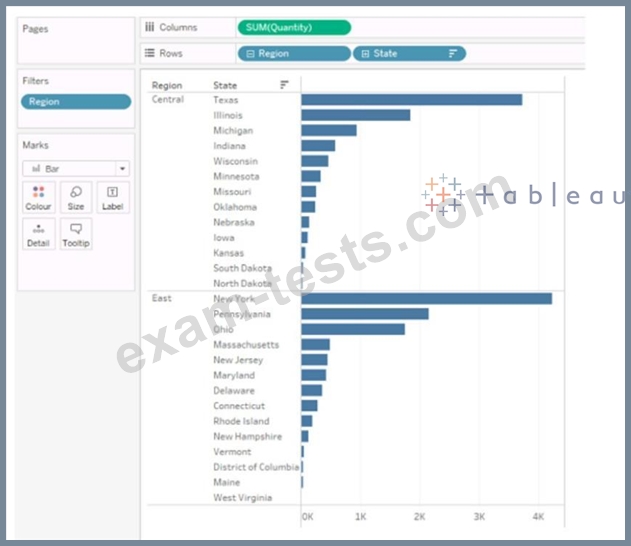
Which formula should you use to include a number with the position of each state within each region?
Which formula should you use to include a number with the position of each state within each region?
Question 39
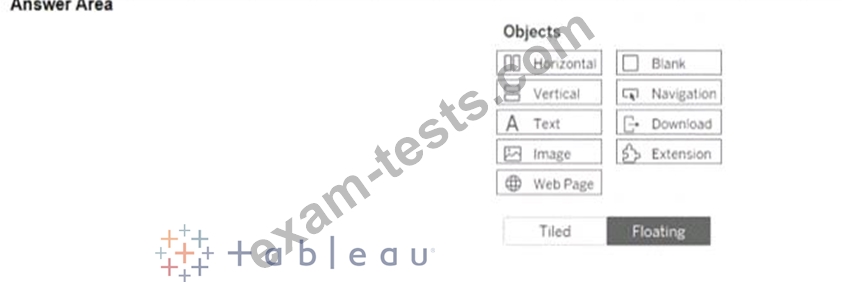
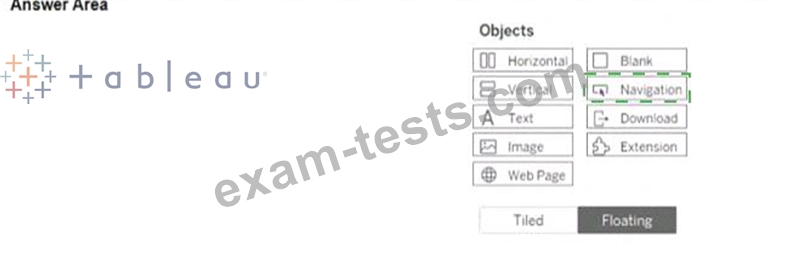
You have a dashboard than contains two sheets named Sheet 1 and Sheet 2.
You want to add an object to the dashboard that users can click to switch to a different dashboard in the workbook.
Which object should you add to the dashboard?
You want to add an object to the dashboard that users can click to switch to a different dashboard in the workbook.
Which object should you add to the dashboard?
Question 40
Open the link to Book1 found on the desktop. Open the CategoryPercentage worksheet.
Modify the bar chart show the percentage of sales for each Subcategory within every Category. The total percentage for every Category must be 100%.
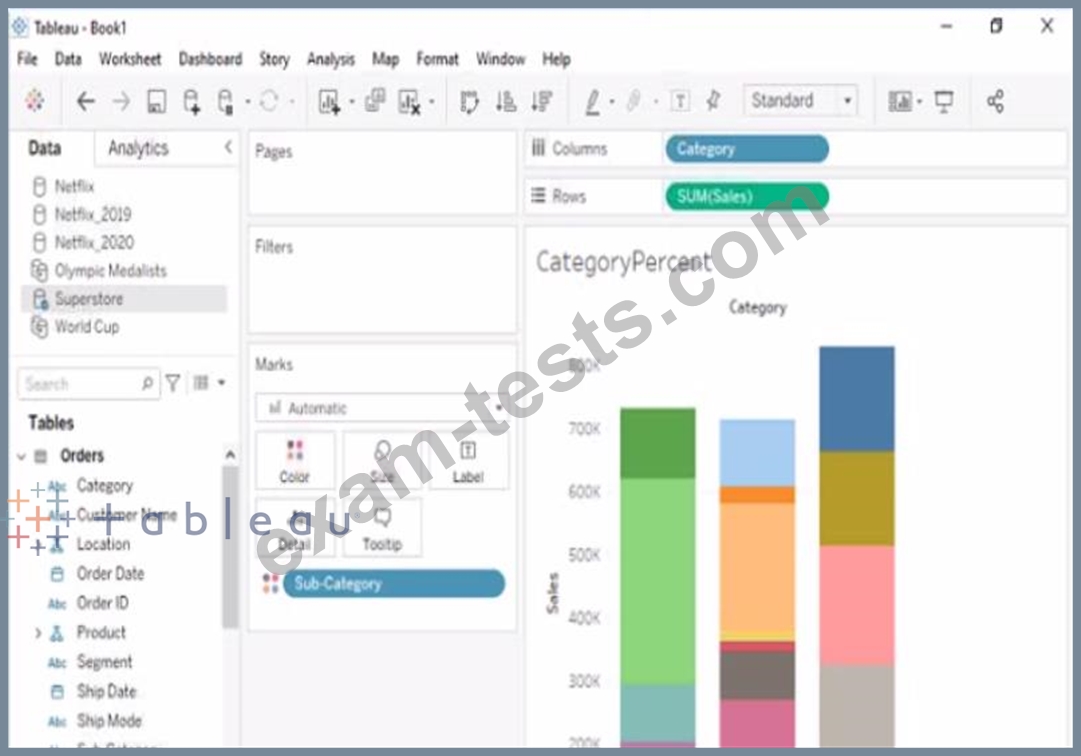
Modify the bar chart show the percentage of sales for each Subcategory within every Category. The total percentage for every Category must be 100%.