
Question 21
You have the following tiled dashboard that has one sheet.
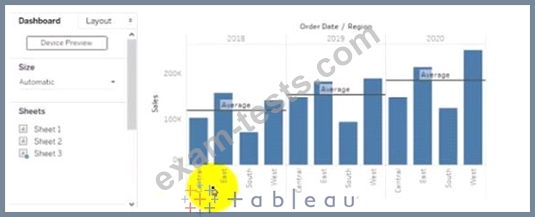
You want to replace fit sheet with Sheet2.
What should you do?
You want to replace fit sheet with Sheet2.
What should you do?
Question 22
You create the following worksheet
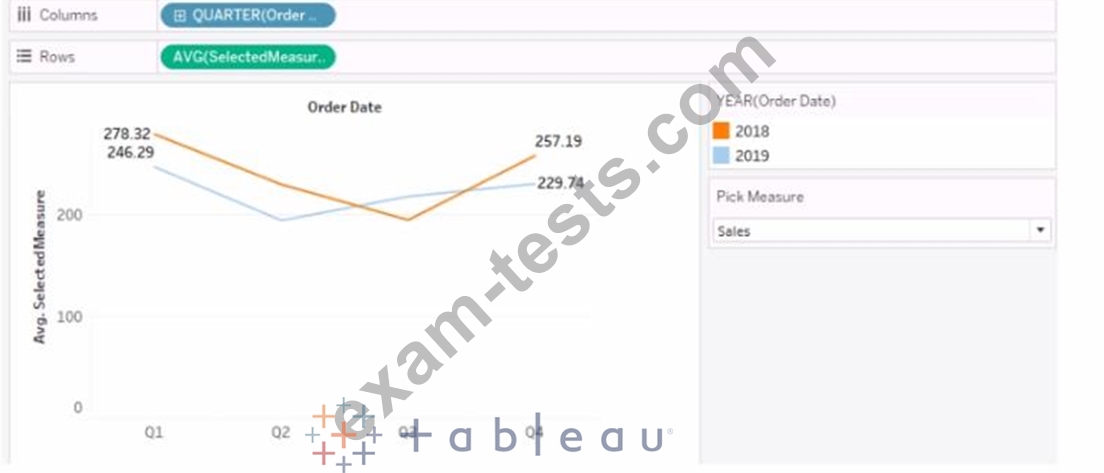
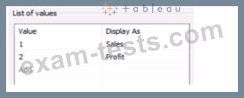
The Pick Measure parameter contains the following list of values
Users can select a value from Pick Measure to change the visualization to show either the Sales measure or the Profit measure.
Which formula is used in the Selected Measure calculated field lo switch between measures?
The Pick Measure parameter contains the following list of values
Users can select a value from Pick Measure to change the visualization to show either the Sales measure or the Profit measure.
Which formula is used in the Selected Measure calculated field lo switch between measures?
Question 23
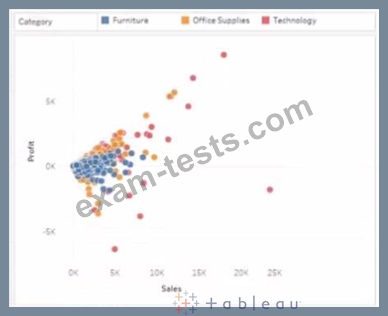
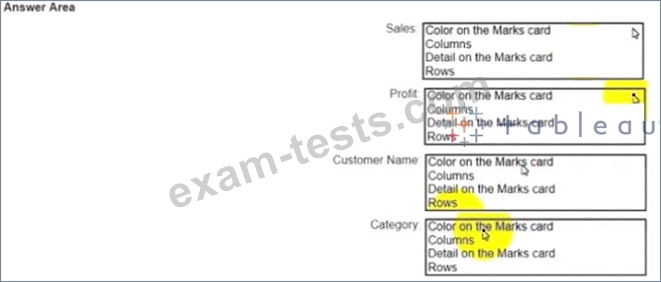
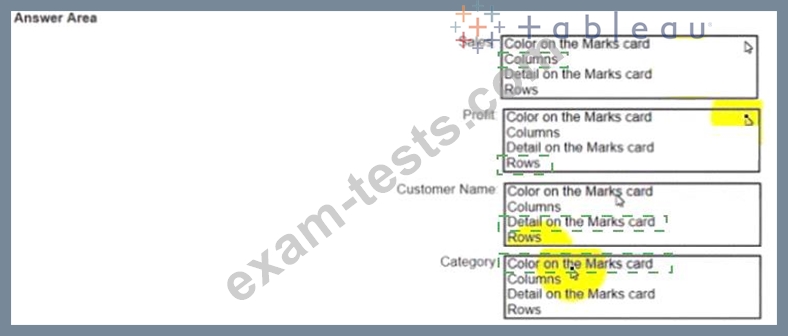
You have a dataset that has four fields named Category. Profit Sates and Customer Name. You need to create the following visualization.
Question 24
You have the following chart that shows profits and discounts over time.
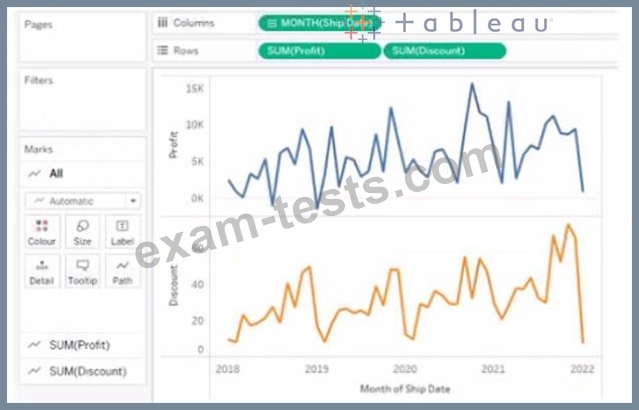
You need to combine the lines to appear as shown in the following chart.
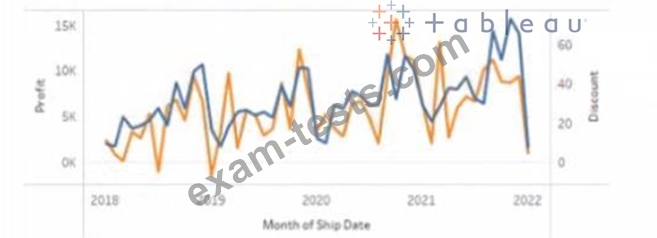
What should you do?
You need to combine the lines to appear as shown in the following chart.
What should you do?
Question 25
Open the Link to Book1 found on the desktop. Open Map worksheet and use Superstore data source.
Create a filed map to show the distribution of total Sales by State across the United States.
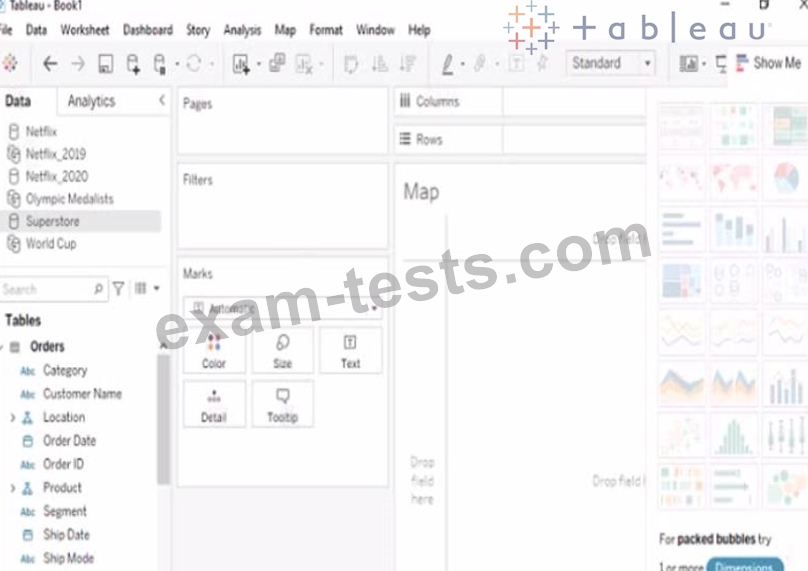
Create a filed map to show the distribution of total Sales by State across the United States.