
Question 26
Open the link to Book1 found on the desktop. Open SalesVSProfit worksheet.
Add a distribution band on Profit to show the standard deviation from- 1 to 1.
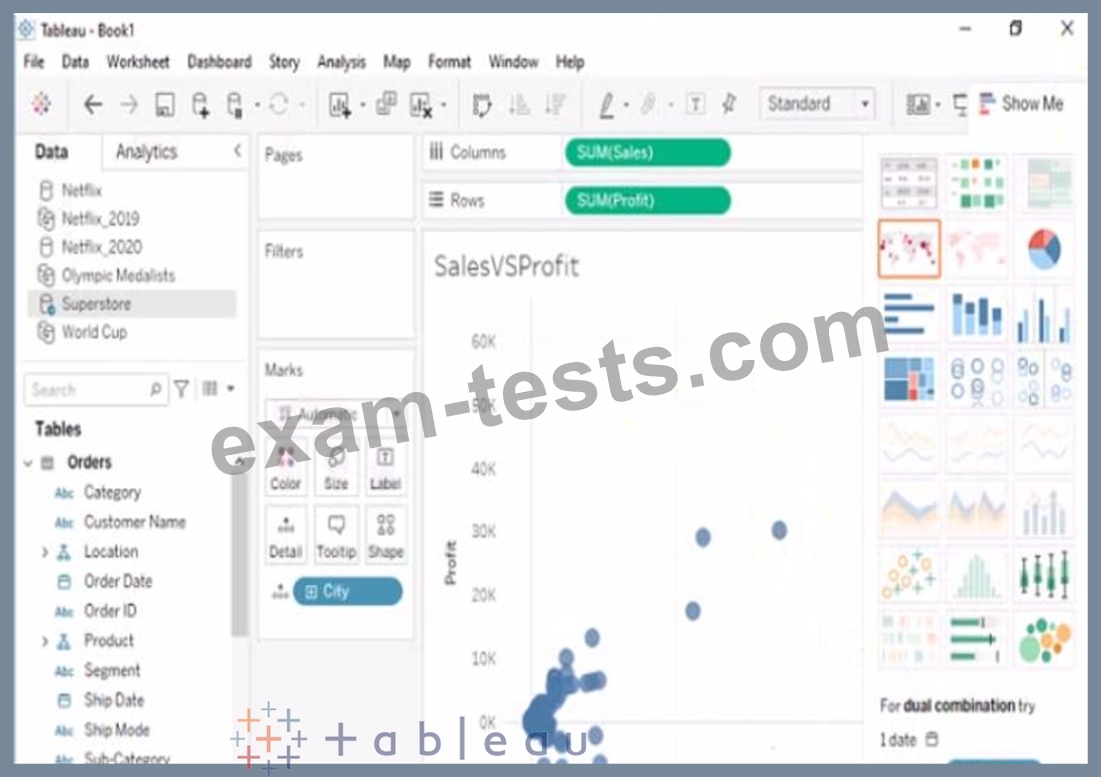
Add a distribution band on Profit to show the standard deviation from- 1 to 1.
Question 27
Open the link to Book1 found on the desktop. Open the Line worksheet.
Modify the chart to show only main and max values of both measures in each region.
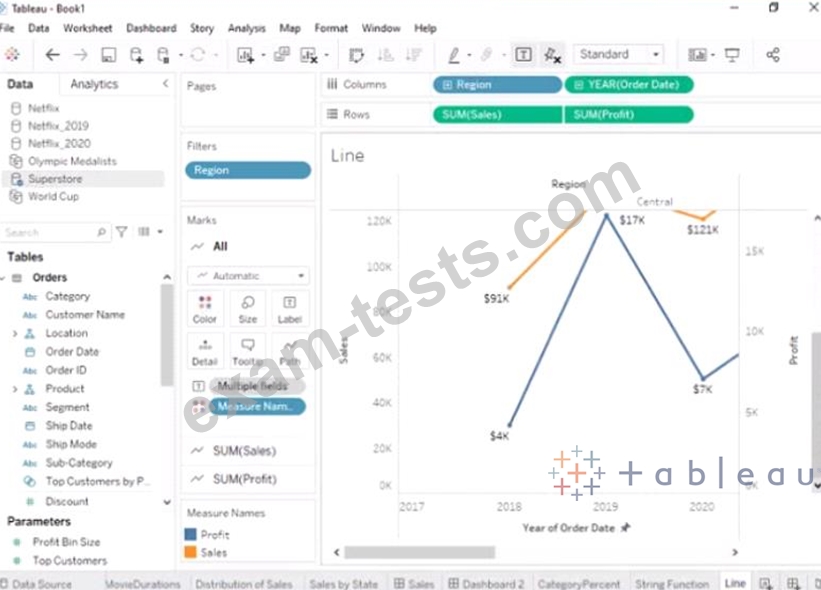
Modify the chart to show only main and max values of both measures in each region.
Question 28
You have the following box plot that shows the distribution of average profits made in every state by region.
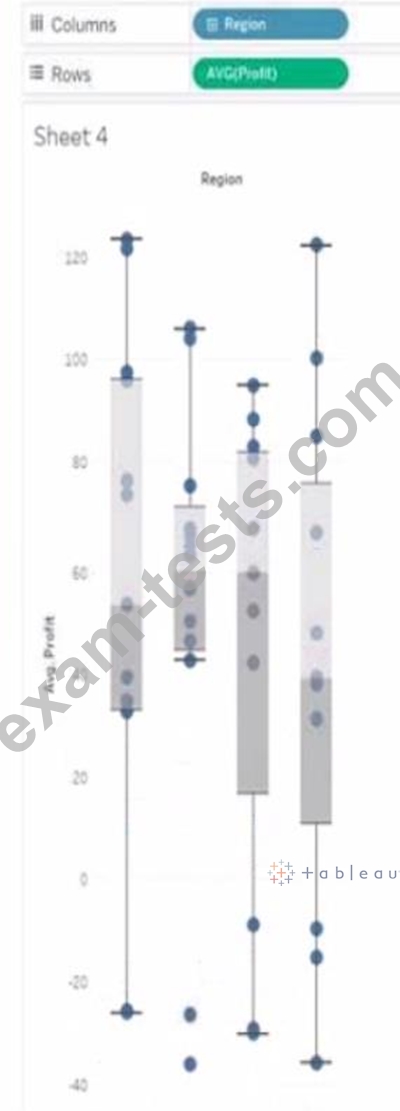
Which region has the smallest distribution of profits?
Which region has the smallest distribution of profits?
Question 29
You have the following dataset.
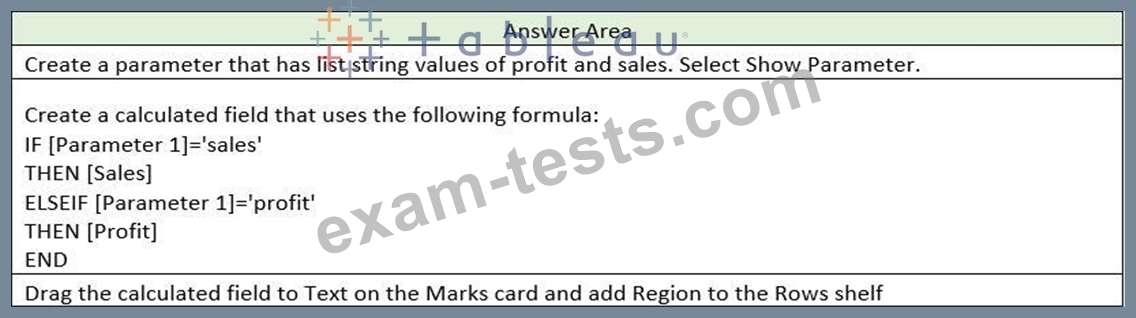
You need to create the following worksheet.
The table must show either profit or sales based on the selection from the Parameter 1 menu.
Which three actions should you perform in orders
(Place the three correct options in order Use the arrows to move Options lo Answer Area Use Answer Area arrows to reorder the options)
Question 30
A Data Analyst creates a parameter named Choose Region that contains values from a field named Region.
The analyst wants users to be able to use the Choose Region parameter to interact with a chart by toggling between different regions.
What should the analyst do next?
The analyst wants users to be able to use the Choose Region parameter to interact with a chart by toggling between different regions.
What should the analyst do next?