Question 16
Question 30: Skipped
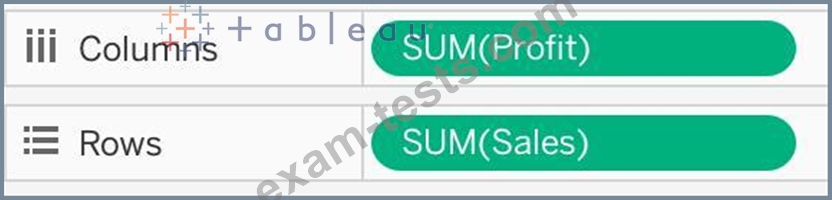
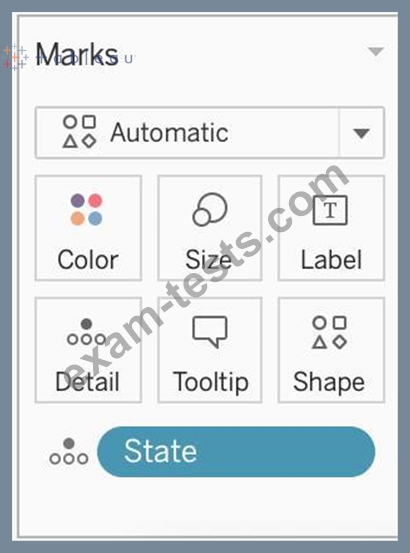
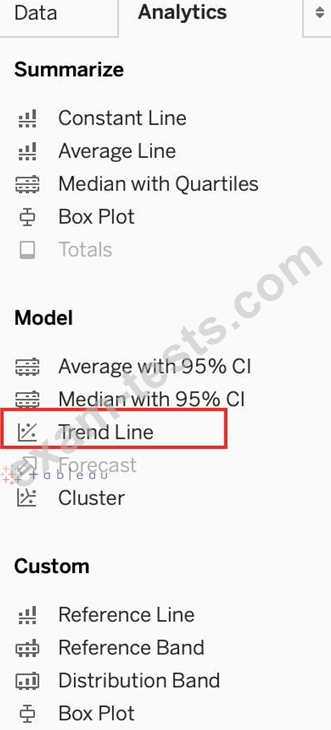
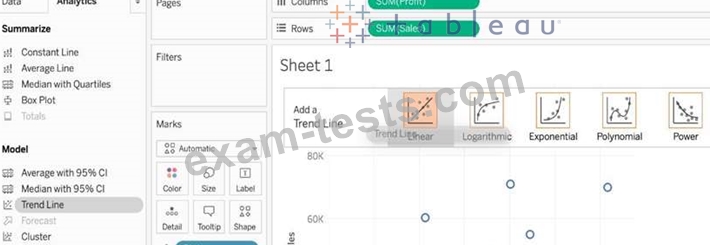
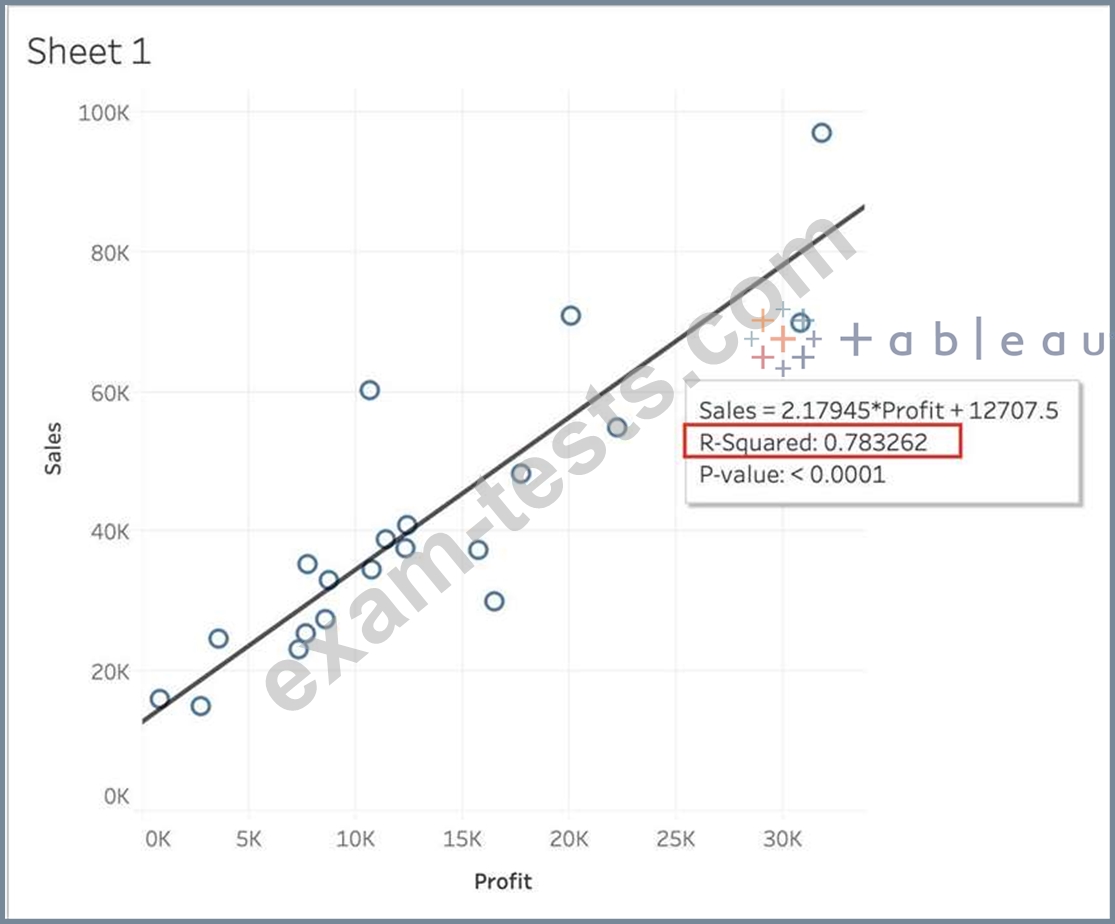
Using the CoffeeChain table, create a scatter plot of Profit (x-axis) vs Sales (y-axis) broken down by State.
Add a Linear trend line to the view. What is its R-squared value?
Using the CoffeeChain table, create a scatter plot of Profit (x-axis) vs Sales (y-axis) broken down by State.
Add a Linear trend line to the view. What is its R-squared value?
Question 17
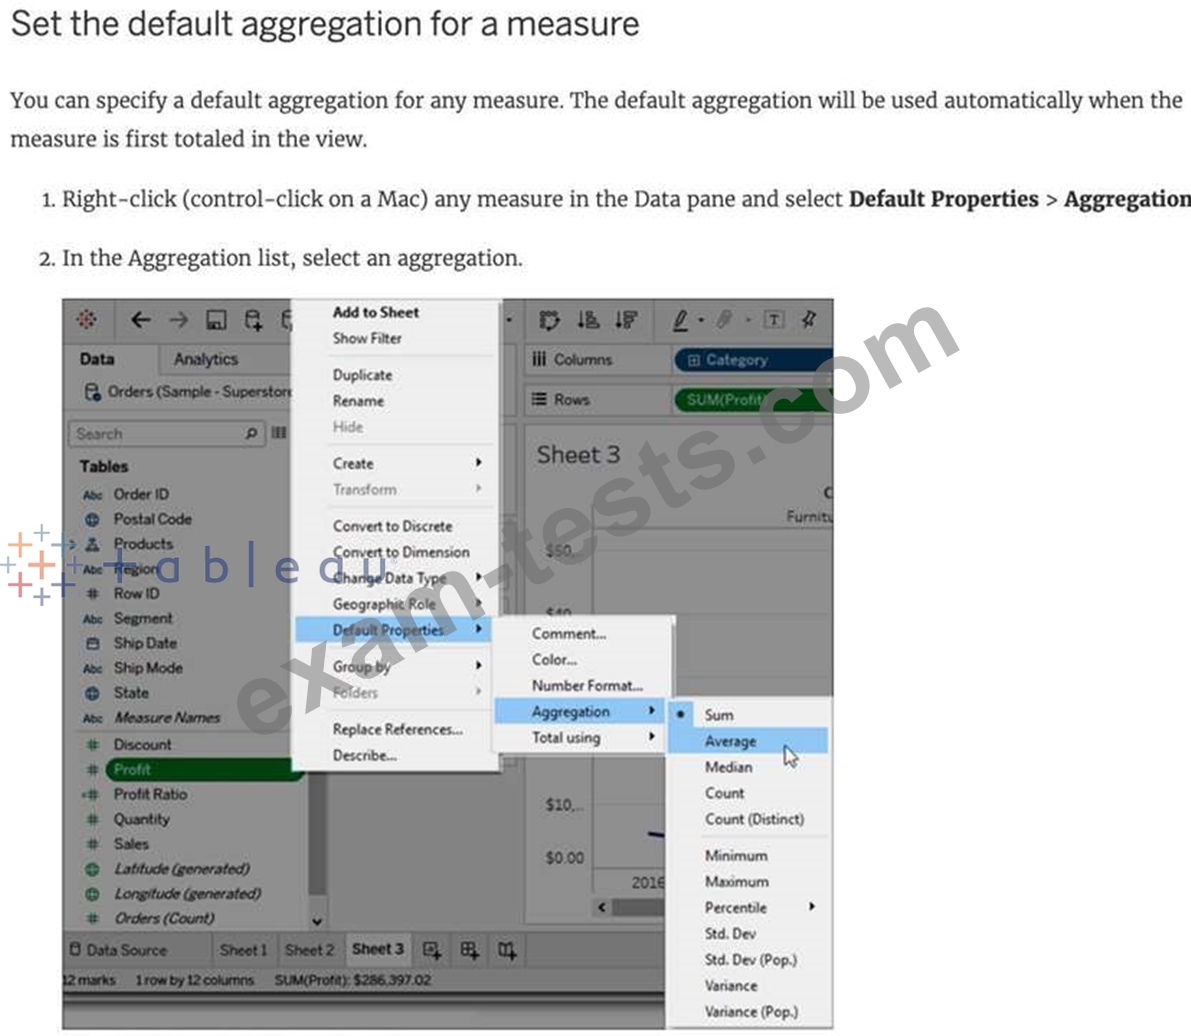
How can you change the Default Aggregation for a measure in Tableau?
Question 18
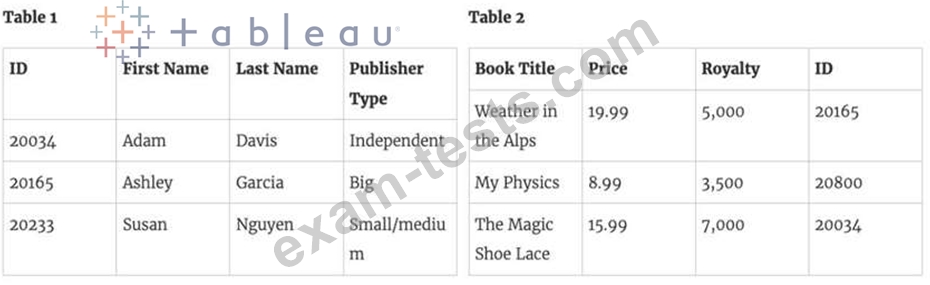
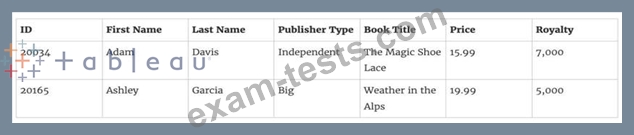
Which of the following would you use to connect to multiple tables in a single data source at once?
Question 19
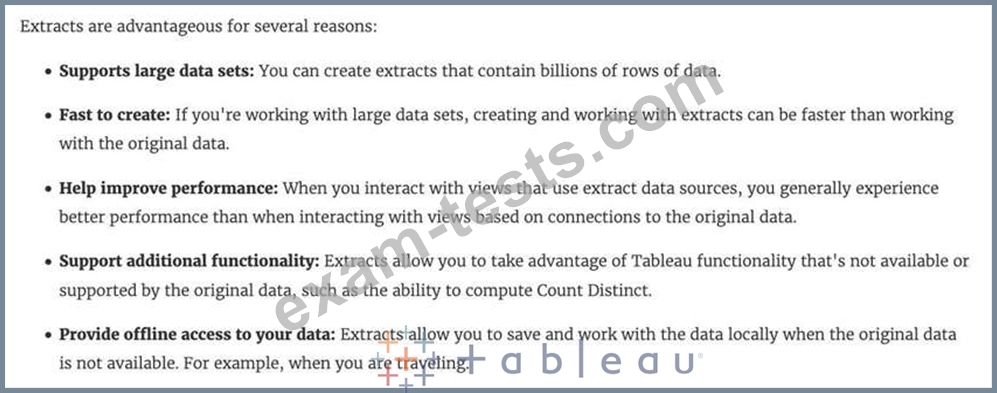
Which of the following are valid reasons to use a Tableau Data Extract (.tde) over Live Connections?
Question 20
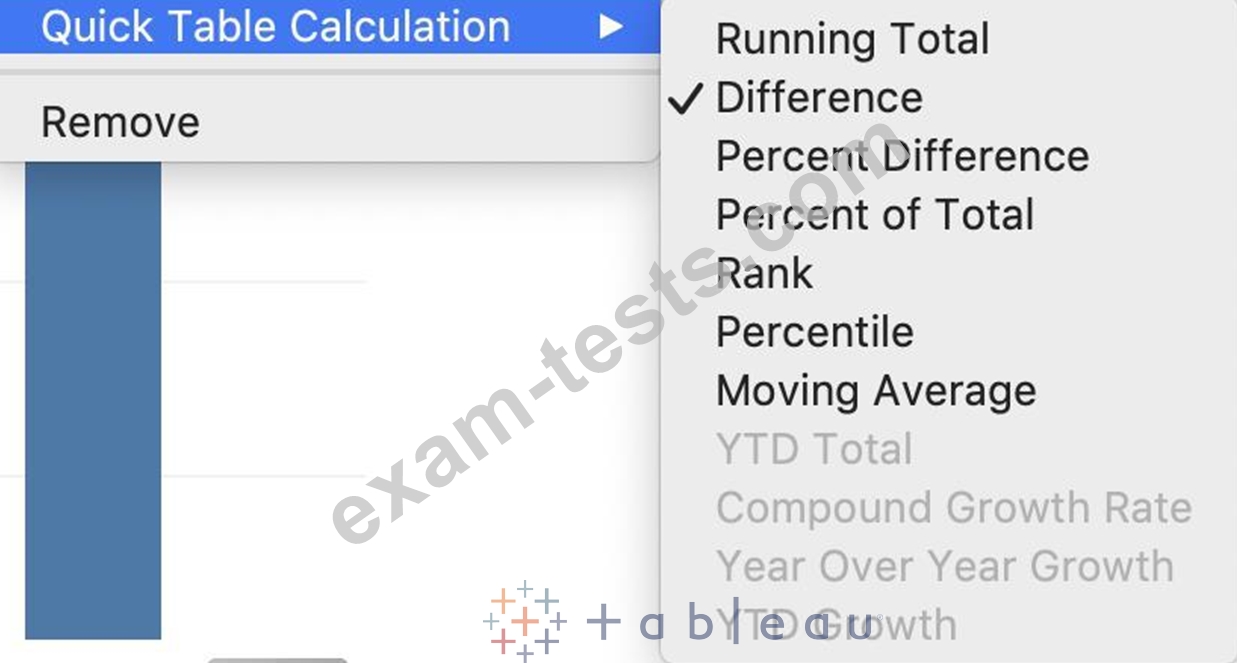
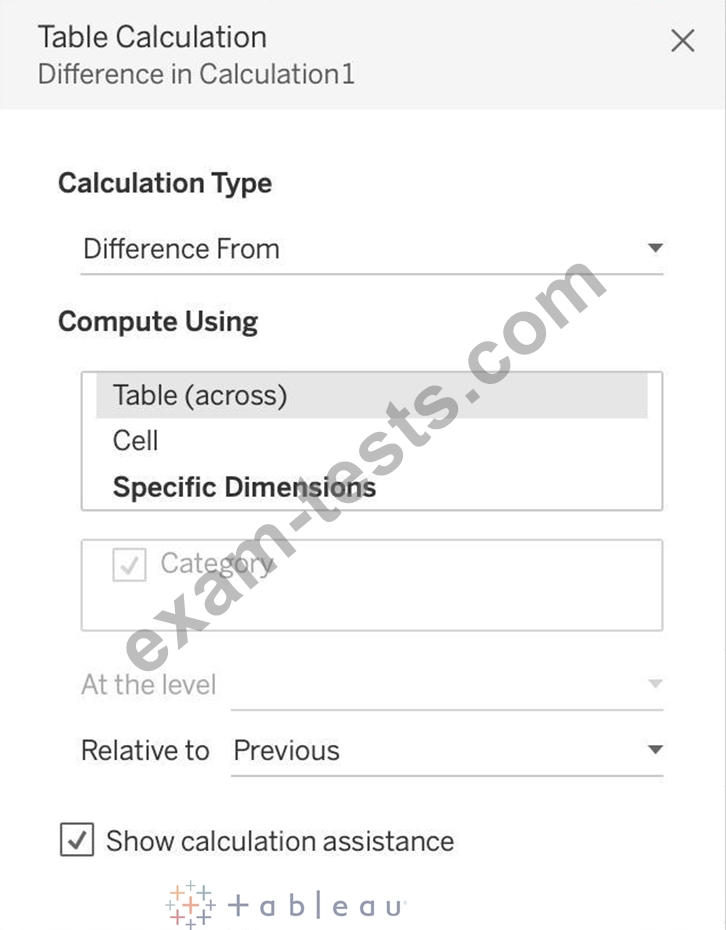
Is SUM a table calculation?