
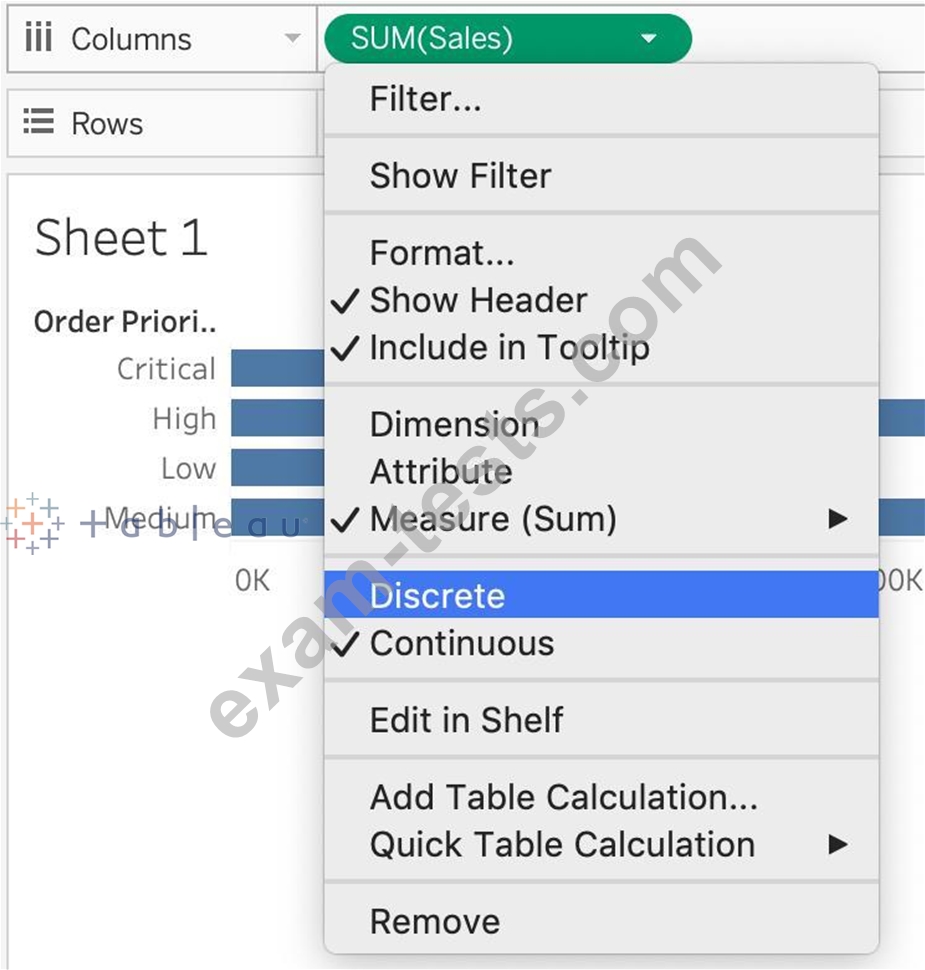
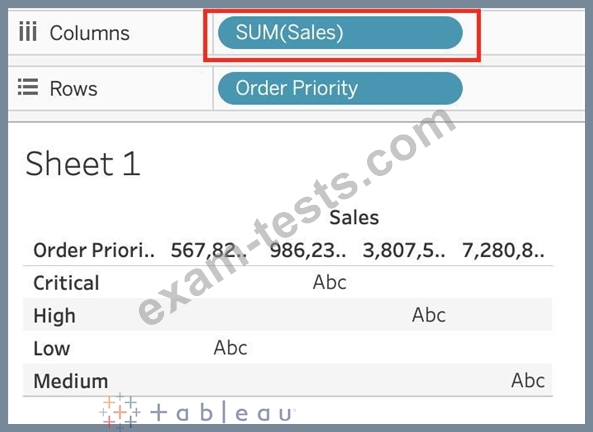
Question 26
Is it possible to make a Measure discrete?
Question 27
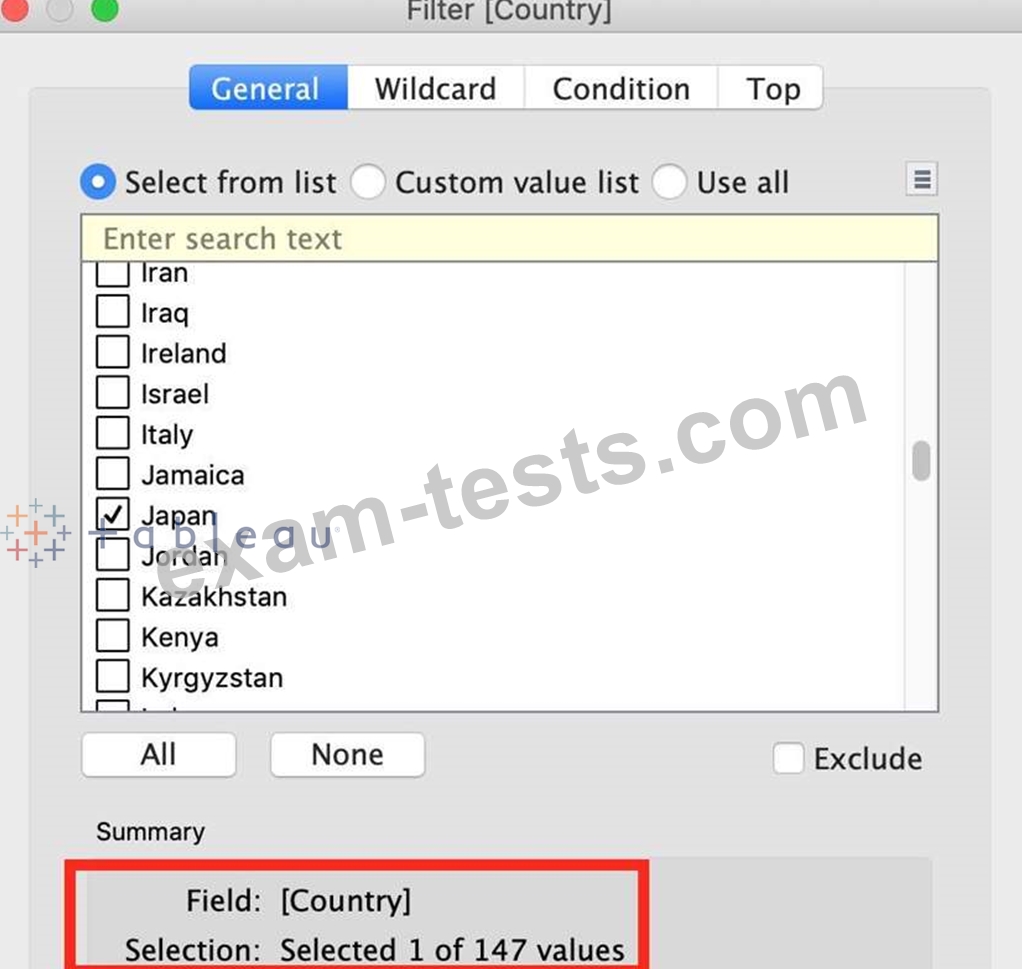
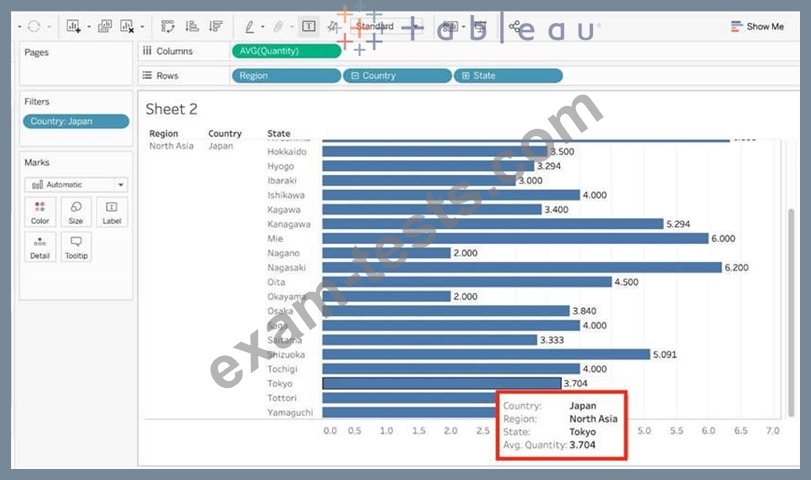
Using the dataset, create a bar chart showing the average Quantity broken down by Region, and filtered by Country to only show Japan. What was the average Quantity in the State of Tokyo?
Question 28
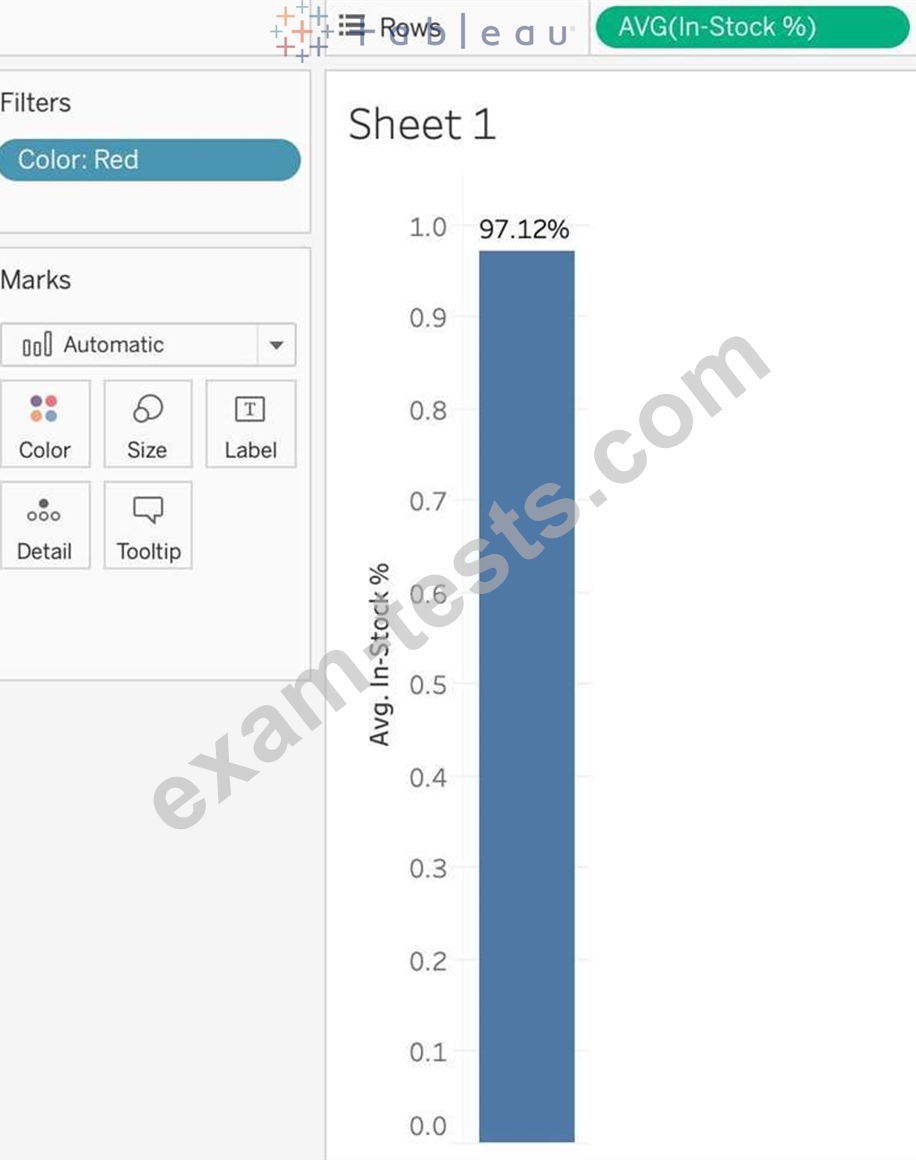
Using the Geo Data table, create a Bar chart showing the In-Stock percentage for each Color. What is the Average In-Stock percentage for the Color Red? Present your answer correctly upto 2 decimal places.
Question 29
DOWNLOAD THE DATASET FROM -
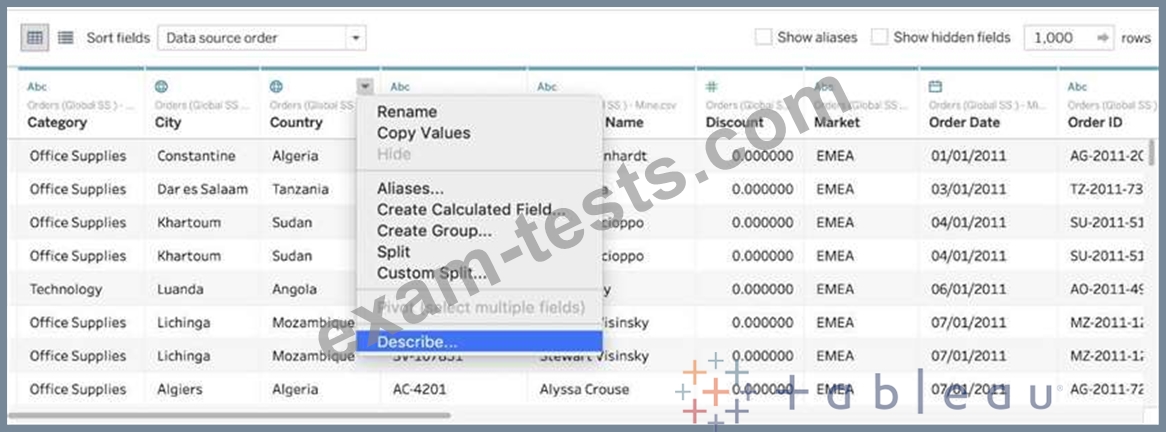
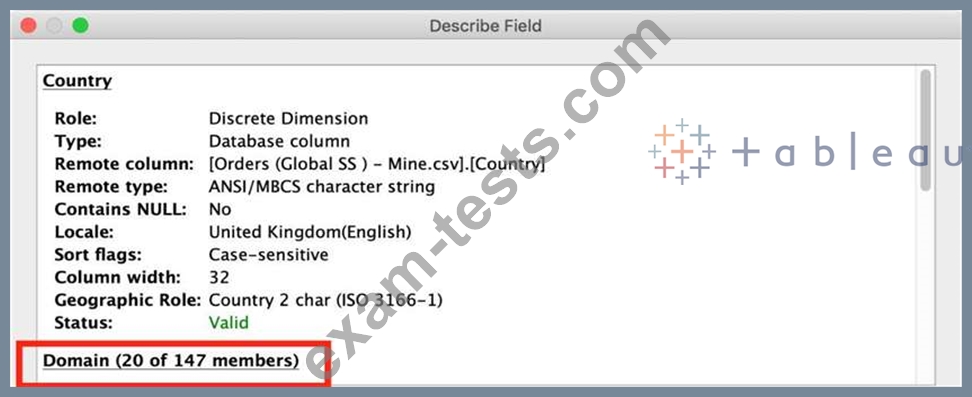
https://drive.google.com/file/d/1F8L_Rl5B9LAz8RDi-DdjWx3Iv-SgzaBq/view?usp=sharing ( if you haven't already from the test instructions page! ) How many different countries are present in the dataset?
https://drive.google.com/file/d/1F8L_Rl5B9LAz8RDi-DdjWx3Iv-SgzaBq/view?usp=sharing ( if you haven't already from the test instructions page! ) How many different countries are present in the dataset?
Question 30
________________ is hosted by Tableau to share our visualisations publically with the world.