Question 111
You have a Q&A visual that displays information from a table named Carriers as shown in the following exhibit.

You need to ensure that users can ask questions by using the term airline or carrier. The solution must minimize changes to the data model.
What should you do?
You need to ensure that users can ask questions by using the term airline or carrier. The solution must minimize changes to the data model.
What should you do?
Question 112
Hotspot Question
You have a report page that contains the visuals shown in the following exhibit.

Use the drop-down menus to select the answer choice that completes each statement based on the information presented in the graphic. NOTE: Each correct selection is worth one point.

You have a report page that contains the visuals shown in the following exhibit.
Use the drop-down menus to select the answer choice that completes each statement based on the information presented in the graphic. NOTE: Each correct selection is worth one point.

Question 113
You are creating a column chart visualization.
You configure groups as shown in the Groups exhibit. {Click the Groups tab.)
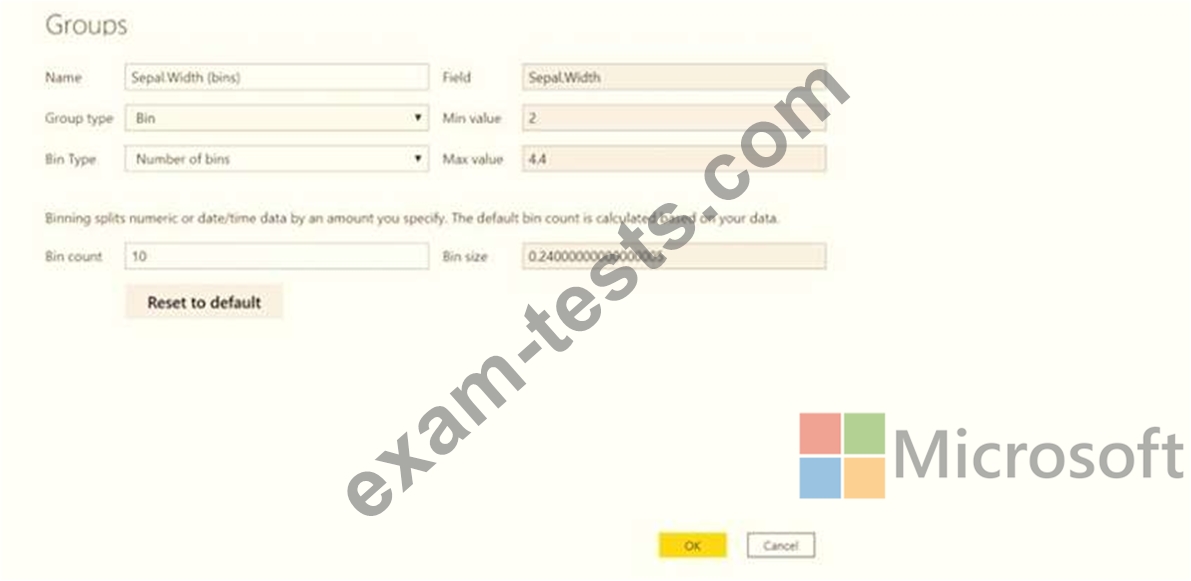
The visualization appears as shown in the Chart exhibit. (Click the Chart tab.)
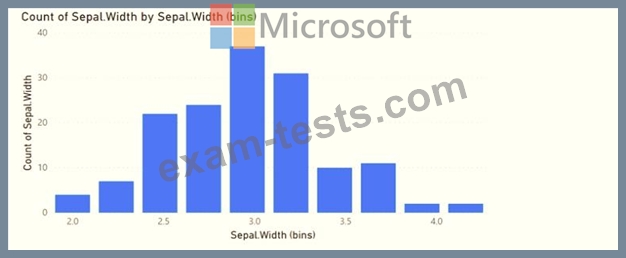
For each of the following statements, select Yes if the statement is true. Otherwise, select No.
NOTE: Each correct selection is worth one point.

You configure groups as shown in the Groups exhibit. {Click the Groups tab.)
The visualization appears as shown in the Chart exhibit. (Click the Chart tab.)
For each of the following statements, select Yes if the statement is true. Otherwise, select No.
NOTE: Each correct selection is worth one point.

Question 114
Drag and Drop Question
You have a Microsoft Power BI data model that contains three tables named Sales, Product, and Date.
The Sales table has an existing measure named [Total Sales] that sums the total sales from the Sales table.
You need to write a calculation that returns the percentage of total sales that a selected ProductCategoryName value represents. The calculation must respect any slicers on ProductCategoryName and must show the percentage of visible total sales. For example, if there are four ProductCategoryName values, and a user filters one out, a table showing ProductCategoryName and the calculation must sum up to 100 percent.
How should you complete the calculation? To answer, drag the appropriate values to the correct targets. Each value may be used once, more than once, or not at all. You may need to drag the split bar between panes or scroll to view content.
NOTE: Each correct selection is worth one point.

Question 115
You have the line chart shown in the exhibit. (Click the Exhibit tab.)
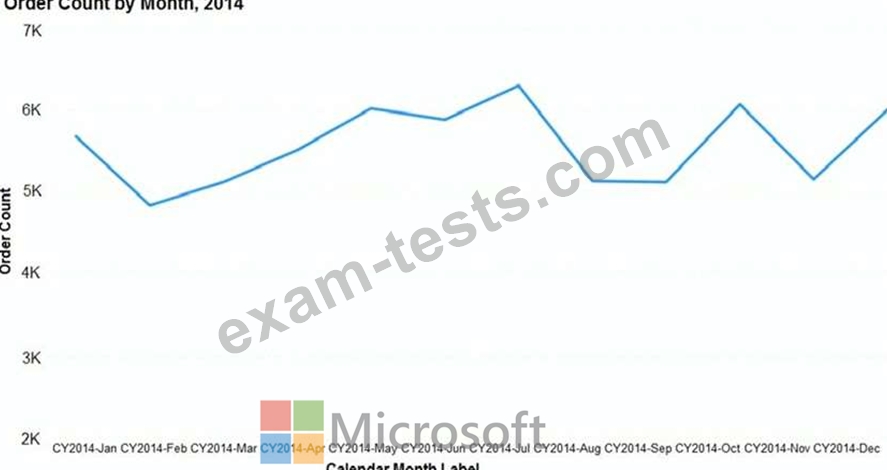
You need to modify the chart to meet the following requirements:
Identify months that have order counts above the mean.
Display the mean monthly order count.
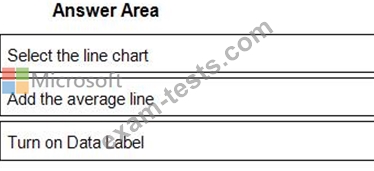
Which three actions should you perform in sequence? To answer, move the appropriate actions from the list of actions to the answer area and arrange them in the correct order.

You need to modify the chart to meet the following requirements:
Identify months that have order counts above the mean.
Display the mean monthly order count.
Which three actions should you perform in sequence? To answer, move the appropriate actions from the list of actions to the answer area and arrange them in the correct order.