
Question 6
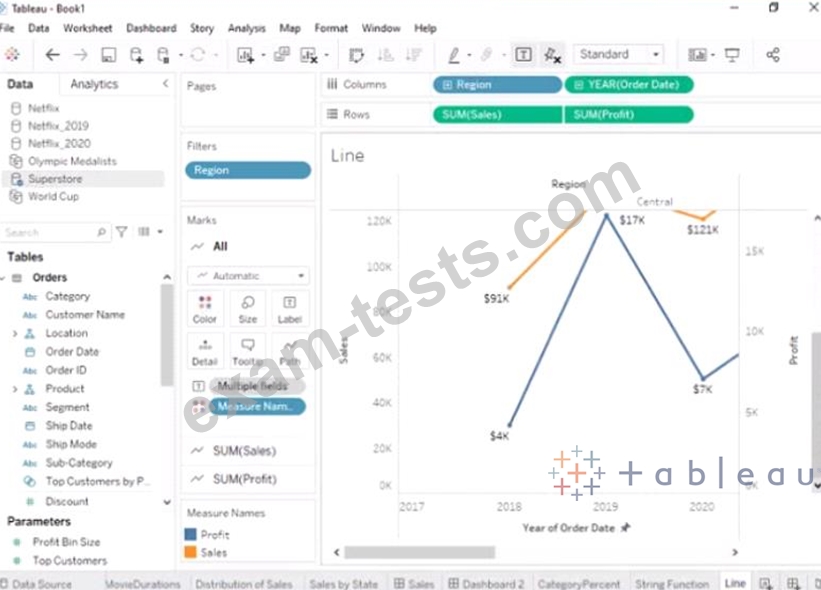
Open the link to Book1 found on the desktop. Open the Line worksheet.
Modify the chart to show only main and max values of both measures in each region.
Modify the chart to show only main and max values of both measures in each region.
Question 7
You have the following dataset.
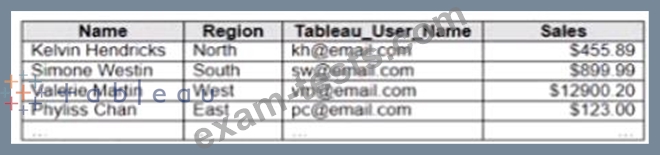
You plan to create a dashboard that will be filtered to show only data that is relevant to a specific Tableau user based on the Tableau_User_Name field You need to create a boolean calculated field to place on the data source finer Which formula should you use for the filter?
You plan to create a dashboard that will be filtered to show only data that is relevant to a specific Tableau user based on the Tableau_User_Name field You need to create a boolean calculated field to place on the data source finer Which formula should you use for the filter?
Question 8
What should a Data Analyst use to visualize the distribution and variability of measure values along an axis?
Question 9
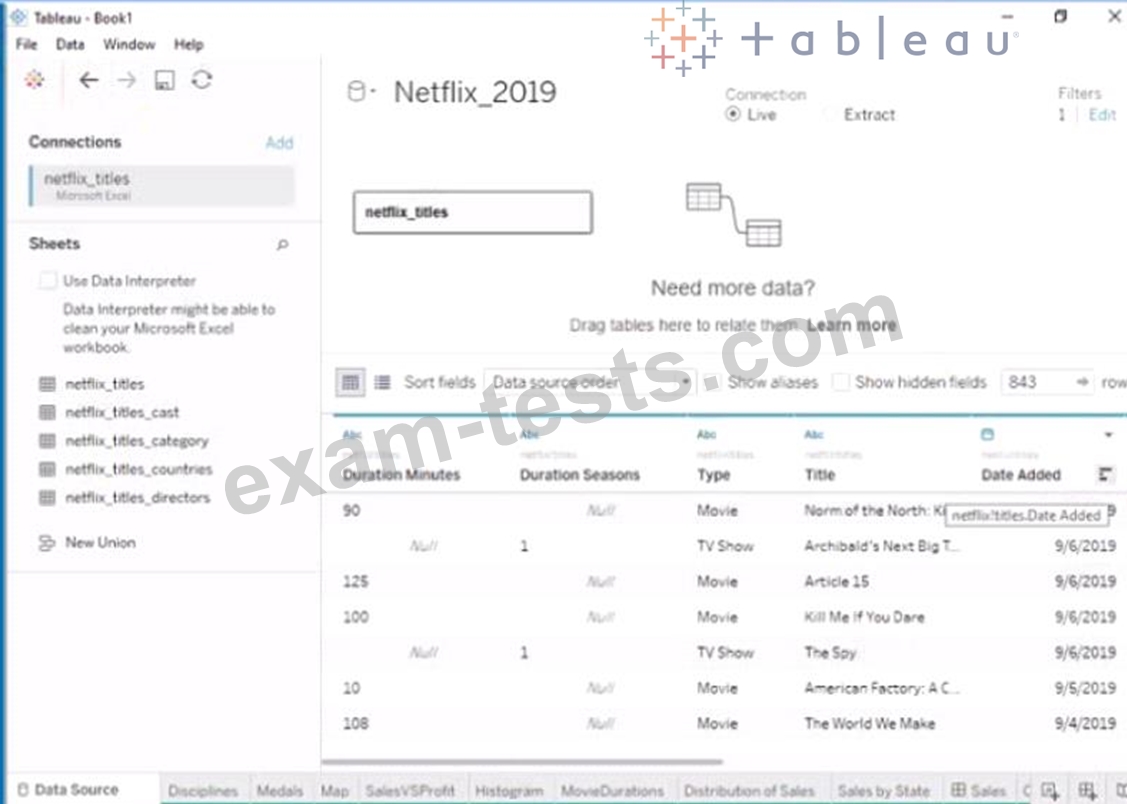
Open the link to Book1 found on the desktop. Open the Movie Durations worksheet.
Replace the existing data source with the Netflix_2019 data source.
Replace the existing data source with the Netflix_2019 data source.
Question 10
You create the following story that contains two story point.
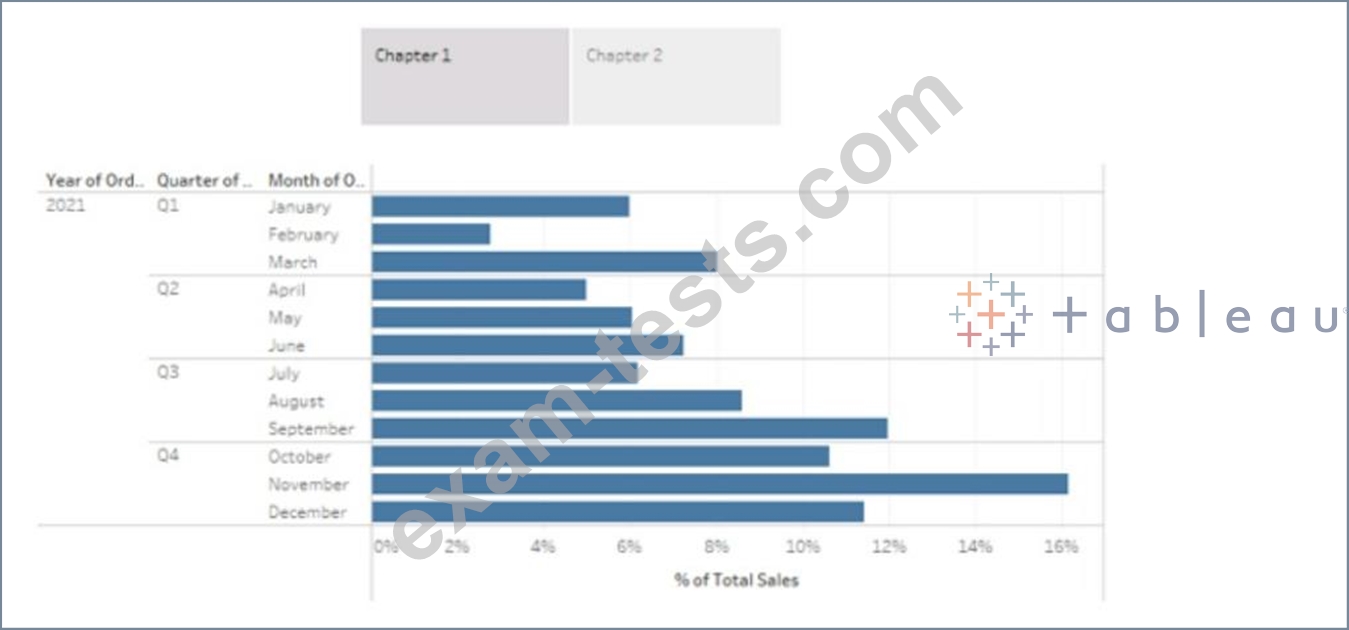
You want to change the story point format to show the current story point number out of the total number of story points.
Which Layout option should you use?
You want to change the story point format to show the current story point number out of the total number of story points.
Which Layout option should you use?